OptiNod Academy
The Open Interest Trap: Why OI Only Matters When You Read It With Price and Funding
The belief that rising open interest means a stronger trend comes from reading OI in isolation. The same increase in OI can mean new capital or late-chasing positions, depending on price and funding.
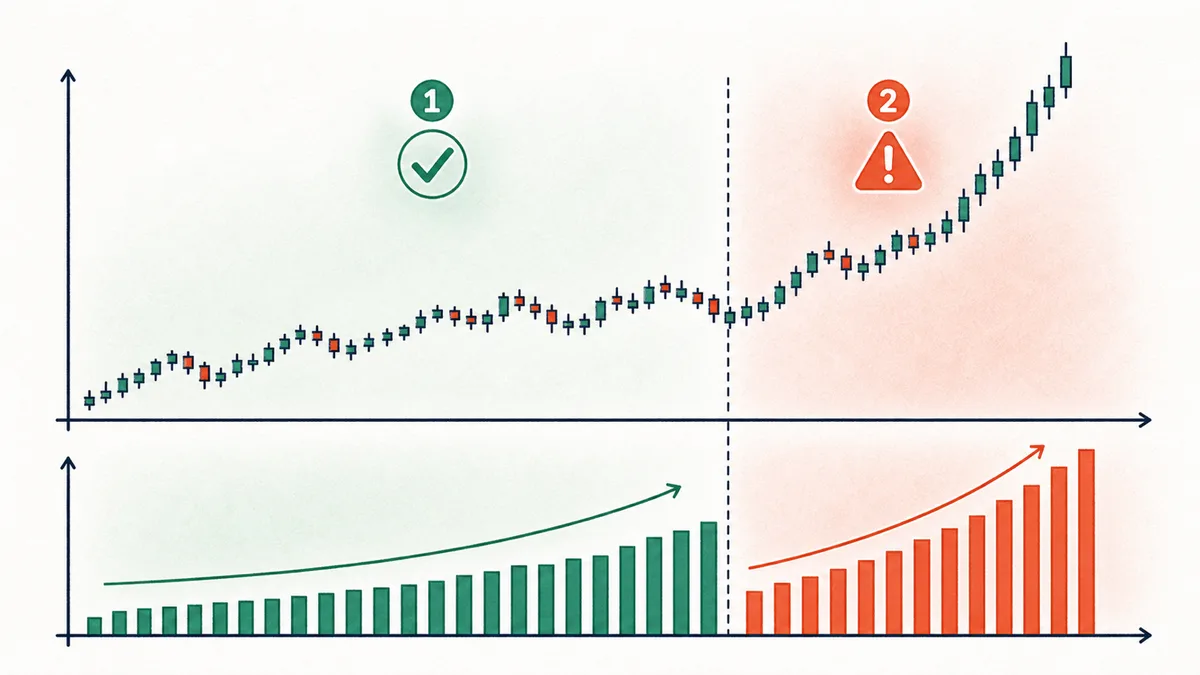
Rising open interest alone does not tell you direction. To know whether that increase is fresh capital or late chasing, you have to read it together with price and funding.
Open interest, or OI, is the total number of futures contracts still open in the market. If one trader opens a new long and another trader on the other side opens a new short, OI increases by 1. If an existing long and short each close one contract in a matched trade, OI decreases by 1. If one side closes and the other opens a new position, OI stays unchanged. Volume counts how many contracts changed hands during a period. OI counts the total amount of bets still tied up in the market right now.
Most traders reduce this to a single line: if OI rises, new money is entering the market, so the trend is getting stronger. When the OI line below the chart rises with price, they read the trend as solid. When OI falls, they read the trend as cooling. Because exchange dashboards prominently display OI changes, this interpretation becomes even more entrenched.
The problem is that the same event, an increase in OI, can carry completely opposite meanings. Rising OI only tells you that new contracts were opened. It does not tell you whether the capital opening those contracts is fresh money entering early in a trend, or late-chasing positions piling in near the end. Those two setups lead to very different outcomes. The first can carry a trend forward. The second becomes fuel for cascading liquidations on even a small move in the opposite direction. OI itself does not tell you which one it is. Direction only becomes clear when OI is read alongside price and funding.

Rising OI Can Mean New Capital or Chasing Positions
An increase of one unit in OI means a new long and a new short have been added to the market as a pair. That fact has no direction by itself. Direction comes from price at the same time. If price rises while OI increases, more of the newly opened contracts came from aggressive longs lifting the market. If price falls while OI increases, more of the newly opened contracts came from aggressive shorts selling the market down. If you look only at the OI line, both situations look identical: OI is moving up.
That is why reading rising OI alone as trend strength means making a decision with only half the information. When OI rises early in a trend, capital that had not yet entered the market is now coming in, leaving room for the trend to extend. When OI jumps after a trend has already run hard, it is more likely to be late money chasing a price that has already moved. The same increase in OI can carry the opposite weight depending on where price is in the trend.
On May 5, 2026, BTCUSDT perpetual futures OI rose by more than 4%, from 108,685 BTC to 113,250 BTC, while price rose from $79,826 to $80,862. Funding stayed near an average of negative 0.005% over the same day, showing no overheating. New longs were entering, but longs were paying little to no cost to shorts. At the time, it could have been fresh capital that would carry the trend. As the May 6–9 case below shows, though, a large part of that increase was closed out within three days. Do not treat an OI increase alone as proof the move will last.
Price x OI Only Becomes Clear When You Split It Into Four Cases
Cross OI increases and decreases with rising and falling price, and you get four cases. Those four cases are the core of OI interpretation.
- Price up + OI up: New longs are driving the trend. Fresh capital is entering and pushing price higher. This is the strongest trend-supporting combination.
- Price up + OI down: Price is rising while the number of open contracts is falling. Existing shorts are likely buying back to cut losses, creating short covering that pushes price up. Trend strength is weaker.
- Price down + OI up: New shorts are driving the trend. Capital is aggressively opening new short positions and pressing price lower.
- Price down + OI down: Longs are closing positions as price falls. This is deleveraging from existing longs taking profit or stopping out.
The price-up, OI-down case is especially easy to misread. On April 20, 2026, BTC jumped 2.8% from $73,758 to $75,790, but OI fell by more than 2%, from 95,460 BTC to 93,279 BTC. It was hard to call that a rally driven by a large wave of new capital. It looked more like shorts built during the prior decline buying back and pushing price higher. It then continued to a $78,140 close on April 22 and pulled back almost 1% to a $77,395 close on the 24th. That 1% pullback alone does not prove the short covering was weak. The four cases classify that 2.8% rise apart from a trend start driven by new capital.

Overheated Funding Plus a Surge in OI Near Highs Builds Liquidation Fuel
Funding is the periodic payment exchanged between longs and shorts to keep perpetual futures prices anchored to spot. When there are too many longs and futures trade above spot, funding turns positive and longs pay shorts. The higher positive funding gets, the more one-sided the market is toward longs. Those longs are paying a cost every funding period just to keep holding.
When rising OI appears together with overheated funding, the message is clearer. Most newly opened contracts are longs on the same side, and those longs are chasing even though they have to pay for the position. Positions built this way can hit liquidation levels after only a small adverse price move. The higher OI is, and the more overheated funding is, the thicker the leverage stacked on top of price. A small drop can trigger forced liquidations, which push price lower, which then triggers the next layer of liquidations. That is how liquidation cascades get their fuel.
Early August 2024 BTC illustrates why baseline funding must be distinguished from overheating. From August 1 to 5, BTCUSDT funding was positive in all 15 settlements, including nine at 0.0100%. That is the usual eight-hour interest-rate baseline, not the funding cap at the time; it alone does not establish unusually expensive long crowding. On August 5, price opened at $58,144, reached $48,888 intraday and closed at $54,003, down 7.1%. Funding hovered near zero from August 6 and reached −0.0069% at the August 7 08:00 settlement. This shows a change in derivatives pricing premiums; liquidation size and selloff causation require separate OI, liquidation and trade data.
Even if funding is calm, a sudden jump in OI near the highs after a trend has already run is dangerous by itself. When price has already risen a lot and the risk-reward for new entries has deteriorated, a spike in OI means late capital is chasing with tight stops. The liquidation levels for those positions cluster close to the current price. When liquidation levels cluster in one area, even a small adverse move can trigger them all at once. Forced liquidations execute as market orders in the opposite direction, so they push price further. If that lower price reaches the next liquidation zone, more market orders come out. The thicker OI is, the more positions must unwind once the move starts, and the deeper the decline can become.
On May 15, 2026, BTC perpetual OI jumped noticeably from the previous few days to 110,454 BTC. That same day, price fell 2.4% from $81,049 to $79,074. Over the following days, as price moved down into the $76,000 area, OI fell to around 100,861 BTC. Roughly 9,600 BTC of OI that had expanded near the highs was cleared as price declined over the next several days. That shows much of the OI had been chasing positions that were later unwound through liquidations or stops. If you had read the OI spike as trend strength, you would have bought exactly where risk was highest.

Falling OI Can Mean Liquidation or Profit-Taking
Falling OI means open contracts are being closed, but price tells you who is closing and why. If price rises while OI falls, shorts are buying back and closing at a loss, which is short covering. If price falls while OI falls, longs are closing positions, which is deleveraging. In either case, the total amount of market bets is shrinking, and the fuel that had been pushing the trend is being removed.
The key distinction is voluntary profit-taking versus forced liquidation. Both reduce OI, but price behavior is different. If OI declines gradually over several days, position holders are more likely taking profit calmly or reducing exposure. If OI drops sharply in a short period while price swings hard, forced liquidations are hitting all at once.
From May 6 to May 9, 2026, OI fell about 11%, from 113,250 BTC to 100,842 BTC, while price moved less than 1%, from $80,862 to $80,155. OI dropped sharply while price barely moved. That was not a forced-liquidation zone. It was calm deleveraging as some of the new longs from May 5 and 6 closed positions. It did signal that the trend was cooling, but it was not a liquidation cascade. Price stability tells you the difference.

Reading Rising OI Alone as Trend Strength Is the Trap
Most bad OI analysis comes from one mistake: assuming the trend is strong just because the OI line is rising. Without checking where price is and how overheated funding is, you cannot separate fresh capital from chasing positions. The moment you read a late-stage OI spike as trend strength, you end up buying into an area crowded with nearby liquidation levels.
The second mistake is treating OI like volume. Volume counts how much trading changed hands during the period. OI counts the total amount of contracts that remain open. Even if volume surges, OI can fall if most of that trading is closing existing positions. If you confuse a volume spike with an OI increase, you may mistake a zone where positions are being unwound and the trend is cooling for a zone where new capital is entering.
The third mistake is ignoring funding or treating every positive reading as overheating. If OI and price rise while funding remains well above that contract’s usual level, watch the cost burden on chasing longs. The usual 0.01% eight-hour baseline alone does not confirm abnormal overheating. Compare the sign, size and settlement interval consistently before interpreting the same OI increase.
Checklist for Confirming Whether a Trend Is Solid
Before using OI as an entry reason, line up price, OI, and funding together. This checklist separates trends powered by fresh capital from trends inflated by chasing positions.
- Price x OI direction: Check whether OI is rising while price is rising. If price is rising but OI is falling, treat it as short covering and hold off on trend-following entries.
- Location within the trend: Check whether the OI increase is happening early in the trend or late, after price has already risen 20% or more from the low that started the trend. A late-stage OI spike should be treated as accumulated chasing positions.
- Funding overheating: Compare funding with the contract’s usual level over the same settlement interval. The usual eight-hour 0.01% baseline is not a cap. If above-normal positive funding persists while OI rises, assess carrying costs and liquidation risk before opening new longs.
- Hold off on new entries right after an OI spike: Do not open new entries right after OI jumps more than 10% above its recent average in a short period. Treat it as a place where fuel for a liquidation cascade has built up, and wait until price has worked through that area.
Two Ways to Add Weight to OI Analysis
To improve the accuracy of OI signals, look at two additional inputs alongside it.
First, compare absolute OI with its recent trend. An increase from a low level has a different risk context from further growth at an already high level. High OI alone does not prove that new capital is exhausted. Combine price location, funding relative to normal and liquidation data to judge leverage vulnerability.
Second, read OI together with liquidation data. Exchange liquidation heatmaps and liquidation-size indicators show where the leverage inside OI is clustered by price level. If inflated OI near a high sits above a dense cluster of liquidations at a specific price, a move into that price can easily trigger a cascade. OI tells you the total size of the bets. Liquidation data tells you where those bets are likely to break. You need both data points together to tell whether rising OI is fresh capital that can carry the trend, or a pile of chasing positions that can collapse on a small shock. OI is not directional by itself. It becomes a tool for judging how solid a trend is only when price and funding sit next to it.