OptiNod Academy
OI — Open Interest
Use the price x OI four-quadrant framework with the funding sign to separate whether the same candle's rise or fall is a fresh entry or a close.
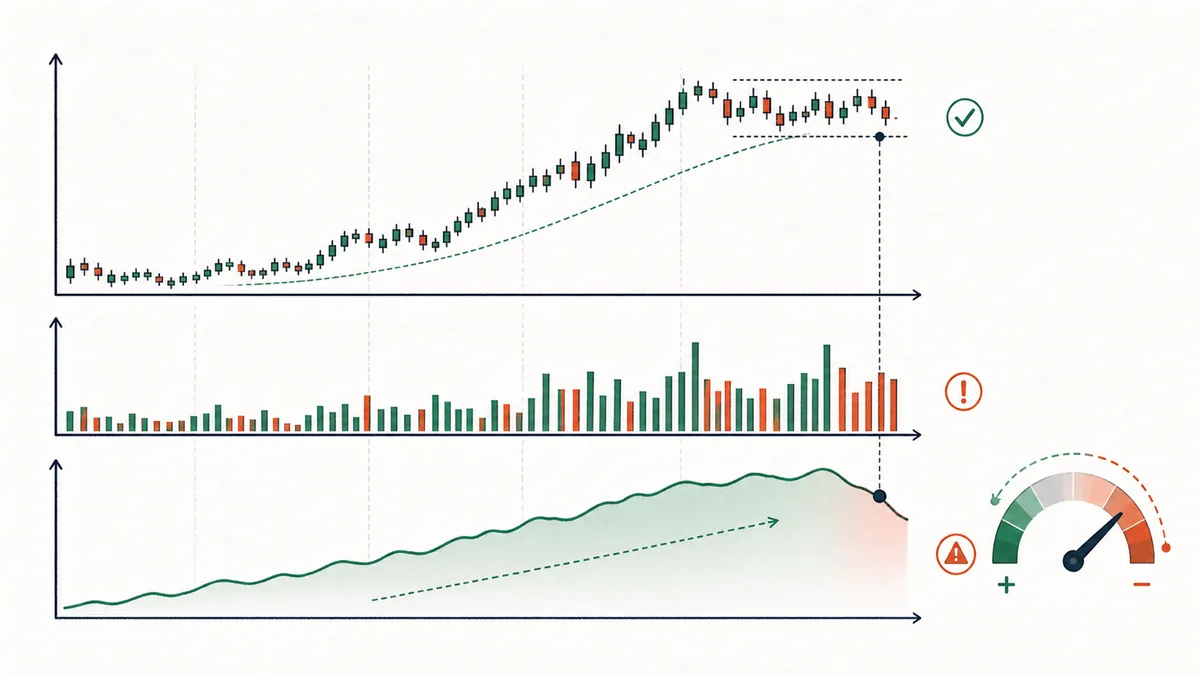
OI, or open interest, is the total number of open contracts in the market at a given point in time. It carries different information from volume. Volume tells you how much trading occurred during the candle. OI tells you how much capital is currently committed. Volume can surge while OI stays flat if existing holders are simply trading with each other. The opposite can also happen: an otherwise ordinary candle by volume can produce a large increase in OI if a large new position meets a new counterparty.
The absolute level of OI alone offers very little trading information. "BTC OI 28B" stands as a number alone, with no trade thesis attached. What matters is the change in OI, and that change only becomes useful when you read it alongside price. One level deeper, combining the price x OI setup with the sign of the funding rate lets you tell whether that candle is a fresh entry or a close.

The four quadrants — a diagnostic table for price x OI
Price can move up or down. OI can rise or fall. Each of the four combinations points to a different market state.
- Price up + OI up -> long buildup: New buyers are opening positions against new sellers. Capital is entering the market as price rises. This is the strongest form of uptrend.
- Price up + OI down → possible short covering or short liquidations: Buying back existing shorts can raise price while reducing OI. Long profit-taking is selling, so it does not explain the upward pressure. This combination alone does not establish who closed positions or how long the rise will last; check trade and liquidation data.
- Price down + OI up -> short buildup: New sellers are entering and pushing price lower. This is a phase where the bearish trend is strengthening.
- Price down + OI down -> long liquidation (long capitulation): Existing long positions are being liquidated as price falls. This is a decline driven by capital leaving the market. Once the liquidation is complete, a short-term rebound can follow.
A bullish candle with OI +5% differs from one with OI −5%. If price-up, OI-down candles become more common in an uptrend, consider whether short buybacks rather than net contract creation are supporting the advance. Price and OI alone cannot confirm that mechanism.

Add the funding sign — four rising-price cases
In perpetual futures, combining the sign of the funding rate with the four quadrants gives you another layer of detail on who is driving the candle.
- Price up + OI up + positive funding: New longs are driving the buying. This is the cleanest uptrend structure, but if the funding rate is extremely positive, longs are crowded to one side and the risk of a short-term close rises with it.
- Price up + OI up + negative funding: New shorts are increasing, but price is moving higher. If shorts are entering and price still rises, those short entrants are likely to be stopped out or squeezed soon. This is one of the strongest bullish signals when it appears against the prevailing bias.
- Price up + OI down + positive funding: Short buybacks may lift price while longs take profit. Positive funding alone does not mean long profit-taking caused the rally. Falling OI means a net reduction in open contracts, not proof that no new capital entered or that the rally must soon end.
- Price up + OI down + negative funding: This is a short squeeze in its purest form. The short crowding implied by negative funding is being forced out, pushing price higher. It can be explosive, but it is usually short-lived. Once the liquidation is over, price often returns toward the same area.
The downside sub-states split the same way.
- Price down + OI up + positive funding: New shorts are entering while longs are still crowded to one side. Read this as the stage before a cascade of forced long liquidations.
- Price down + OI up + negative funding: New short entries are closer to the side pushing price down. If the funding rate is extremely negative, shorts are crowded to one side as well.
- Price down + OI down + positive funding: Longs are reduced or closed, open interest falls, and price drops. This is not a decline that new capital entered.
- Price down + OI down + negative funding: Short profit-taking and long closes can show up together. Separate a decline with falling OI from a place where new shorts are driving the trend.
Breaking OI into these eight states makes it useful as a trading tool. With the four quadrants alone, half the signals can be interpreted both ways. Adding the funding sign shows who is driving the entry flow.

OI confirmation on range breakouts
OI confirmation can be used as a supporting filter for range-breakout entries. Measure any reduction in false breakouts by asset, timeframe and filter rules; there is no basis here to assume it always halves them.
ETH on the daily chart approaches the prior high area near $4,800.Below that area, it builds a range for four weeks.A candle closes above the top of the range.During the same 24 hours, ETH aggregated OI across exchanges rises clearly above its prior five-day average.The funding rate is positive, but not at an extreme level such as 0.1% or higher.Enter long at that candle's close, with the stop below the midpoint of the range.If OI reverts back to its average within the next three candles, or if price closes back inside the range, treat it as a false breakout and exit.
The key is price breakout + simultaneous OI increase + non-extreme funding. That means fresh capital is entering and lifting price, which points to a real breakout. Extreme funding warns that the entry flow may soon turn into liquidation risk. If price breaks out of the range while OI is normal or falling, the move is more likely to be a short squeeze and can reverse within a few days.
Invert the same setup and it works the same way for short entries on a breakdown below the range.

Liquidation maps are different from OI
The liquidation heatmaps shown by exchanges and data providers show something different from OI. They estimate where the forced-liquidation prices of leveraged positions are stacked, and they mark in advance the places where price can be pulled quickly. This is what domestic futures traders call a liquidation map, a long liquidation line, or a short liquidation line. If open interest is the total balance of outstanding positions, a liquidation map is a secondary map showing where that balance may be forcibly closed.
Mixing the two leads to misreads. An increase in OI means new positions have been added. Liquidation levels estimate where those positions may be forcibly liquidated. A rise in OI does not automatically turn a specific price level into a target. First read the direction of capital through price x OI x funding. Then use the liquidation map to identify where stops and take-profits may cluster.
If large long liquidations are stacked heavily below price, that area can become a take-profit candidate for shorts. If large short liquidations are stacked above price, that area can become a take-profit candidate for longs. But do not automatically enter the opposite direction just because price touches a liquidation level. Look for a reversal response only when OI falls after the liquidation, delta turns the other way, and price closes back inside the zone.

What a sharp OI drop before expiry means
A sharp drop in OI just before futures or options expiry carries no signal by itself. Treat it as a period where your interpretation needs adjustment. OI falling as expiring contracts are closed or rolled over is normal market behavior. Reading buy or sell intent from OI changes during this period creates false signals.
In markets with clear quarterly or monthly expiries, such as CME Bitcoin futures, do not read OI declines during the week before expiry as a sign that the flow has changed. It is normal for OI to start building again from the day after expiry. The price area where that accumulation begins shows where capital is entering for the next month.
Around options expiry, also check gamma hedge flows. US equity derivatives quad witching and quarterly BTC options expiry are expiries in different markets. Depending on positioning, gamma hedging can dampen or amplify moves, so do not assume a direction. If expiry-related flows cannot be separated, defer directional OI signals during that period.
Where OI loses meaning
The most common errors happen when traders rely on OI from a single exchange. If you judge the whole market from Binance OI alone, you miss flows on OKX, Bybit, CME, and Deribit. Use aggregated OI from data providers such as Coinglass or Laevitas to read the broader market. When single-exchange OI suddenly changes sharply, the cause is often specific to that exchange, such as a delisting, a change to its liquidation engine, or a fee-policy change.
Another trap is mixing contract and API field units. In Binance OI statistics, COIN-M BTCUSD sumOpenInterest counts contracts and sumOpenInterestValue is BTC value. USDⓈ-M BTCUSDT quantity is in BTC and value in USDT. Distinguish contracts, base-asset quantity, and value, then use contract specifications and prices to compare a common notional unit.
The third mistake is applying the concept of OI to spot markets. In spot, ownership of the asset transfers immediately when a buy is executed, so there is no concept of an outstanding contract. "BTC OI" always refers to aggregate derivatives-market open interest. Track spot flows separately with OBV or volume.
Two forms of convergence that add weight to OI signals
To use OI analysis with confidence, two things should come together.
- Funding-rate sign and intensity: In perp markets, funding and OI should be read together to identify market crowding accurately. Strong positive funding plus a large OI increase means long crowding. Strong negative funding plus a large OI increase means short crowding. Extremely crowded conditions are where you start looking for setups in the opposite direction.
- Thickness of the liquidation heatmap: Knowing where liquidation levels are stacked, and how heavily, helps you see where price may be pulled. If your entry stop sits just above or below a major liquidation level, that stop is likely to be swept first. Give the stop some distance from the liquidation level.
