OptiNod Academy
EMA - Exponential Moving Average
Use changes in the angle of EMA alignment to spot possible trend reversals before a golden cross.
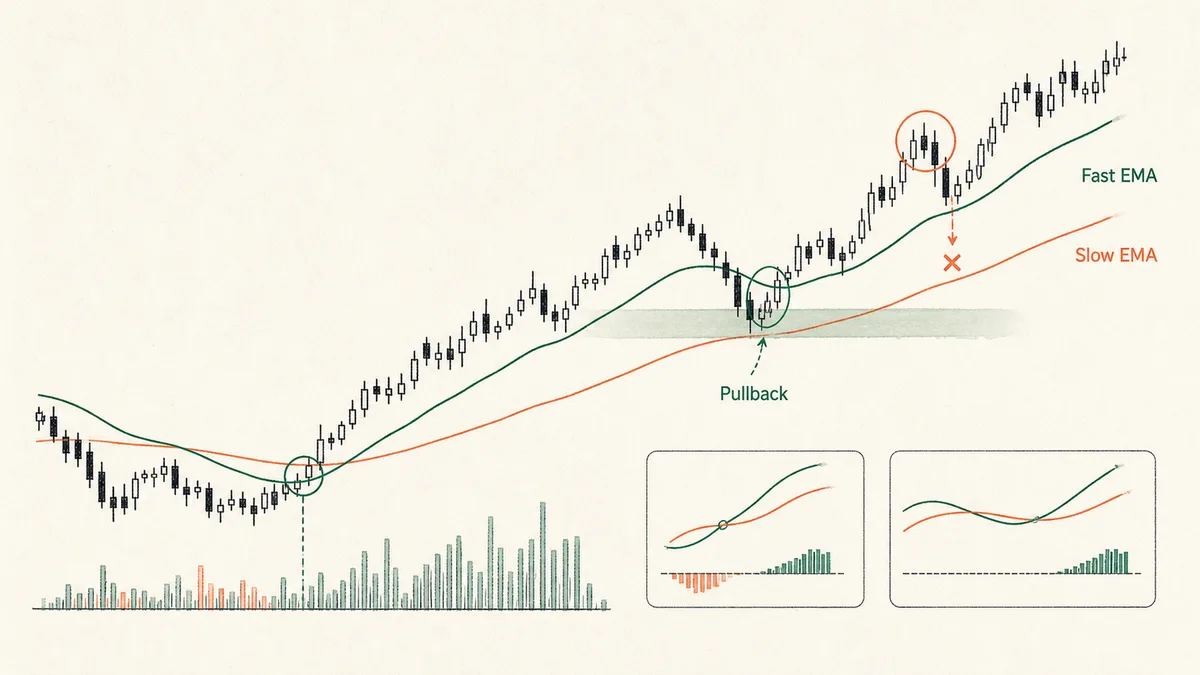
A golden cross in the EMA is the point where the short EMA crosses above the long EMA from below. That moment is already after the short line has crossed the long line. In the days before the two lines meet, the short EMA bends up out of a flat stretch, and the long EMA bends a beat later. Right before the two lines meet, the short EMA has already changed direction while the long EMA is still flat. That difference in angle can reveal a possible trend shift before the crossover, but the lead time varies by asset and period.
The crossover is the result. The angle is the process. If you read EMA only as a crossing point between two lines, you see the outcome after it has already formed. If you read how the two lines are bending, you see the process that creates that outcome.

9, 21, 50, and 200 are conventions that stuck
EMA periods 9, 21, 50, and 200 are widely used conventions. Nine bars is short-term; 21 bars is about one month in U.S. equities; 50 bars is about ten trading weeks; and 200 bars is a long-term window shorter than a year. These are not established as exact calendar-derived settings from a particular era. Compare pullback behavior for your asset and time frame before choosing a period.
Once you accept that, the first step in using EMAs changes. Pull up one or two years of daily candles for the asset you actually trade. Mark the places where price pulled back and then resumed the trend. Then check which EMA periods those reversal points cluster around. The EMA with the densest cluster is the real pullback line for that asset. One distribution check can change the quality of dozens of entries you would otherwise repeat every week.
If NVDA confirms 30, catch pullbacks with 30. If BNB confirms 34, use 34. Skipping this step means you are trading an average success rate that was never verified on the asset in front of you.

Angle changes lead the crossover
To read the slope numerically, track how much the EMA value has changed over the previous 10 bars. If that change is steady, the trend is still intact. If the change is shrinking, the line is flattening. If the change turns negative, the average itself is rolling over. You can plot it, or you can read it visually. What matters is whether the rate of change is improving or deteriorating. The exact formula is secondary.
When TSLA topped near $260 in late December 2023 and started to come down, the 10-bar slope of the 50 EMA fell from +$5.8 on December 28 to +$0.5 on January 10, nearly zero. In this example the short line is a 20-bar EMA, not the article's default 21-bar EMA. The 20/50 death cross came at the January 12 close of $219, after price had already spent almost two weeks falling from the high. This suggests that watching the angle could have prompted an earlier profit-taking review rather than waiting for the crossover. It is not evidence of an actual trader’s execution.
In an uptrend, once the 50 EMA goes flat, the dynamic support underneath price is already weaker even if price is still trading above the line. The same pullback-buy setup has a different probability depending on whether it appears before or after the EMA has flattened.

EMA Cloud - read the zone around the line
If you treat EMA as one thin line, it is easy to assume that a valid pullback must touch that line exactly. Real pullbacks rarely behave that cleanly. They usually arrive in a zone around the average. When you pair two EMAs and shade the area between them, an EMA Cloud makes that zone visible.
The rule is simple. While the cloud is green, meaning the shorter EMA is above the longer EMA, a candle that dips into the cloud and closes back above it is a pullback-buy candidate. If the cloud turns red, a trend change is already underway. The distance between the two EMAs shows trend strength directly. A widening cloud means the trend is strengthening. A narrowing cloud means it is losing force. Parallel lines suggest the trend has entered a more stable phase.
On the BNB daily chart, a distribution check confirms the 13/34 pair as the pullback zone.The cloud remains green in an uptrend.Price pulls into the cloud, then a candle closes back above it.Entry is at that candle's close. The stop goes 0.5 ATR below the lower edge of the cloud, the 34 EMA.If the cloud turns red, or price closes below the lower edge of the cloud, the setup is invalid.
The close is what matters. If price briefly trades below the short EMA intrabar but closes above the cloud, the pullback has likely finished. If the candle itself closes below the cloud, the trend is breaking down. A fixed 1% stop turns normal noise into repeated stop-outs.

The four stages of EMA alignment show trend maturity
Plot three EMAs together, short, medium, and long, and the alignment itself shows how mature the trend is.
- Stage 0 - Tangled: The three EMAs cross around the same price area inside a range. Turn all entry signals off here.
- Stage 1 - Separation begins: The short EMA starts moving away in one direction while the medium and long EMAs are still flat. A trend may be starting, but entries should stay conservative.
- Stage 2 - Full alignment: The short, medium, and long EMAs line up in order, or the reverse order in a downtrend. This is the middle of the trend, where pullback buys usually work best.
- Stage 3 - Compression: The short EMA moves back toward the medium EMA and the gap between them narrows. The trend is weakening, so new entries should be turned off.
The same setup on the same asset can have a very different probability depending on the stage. When NVDA held a Stage 2 bullish alignment in the $800-$1,100 range in May 2024, before the split, pullback buys worked repeatedly. When that alignment moved into Stage 3 compression in August, the same setup stopped working as cleanly.

Short EMAs create the first false signals
After a sharp selloff, a fast rebound often creates a 9/21 golden cross. The short EMA gets pulled up quickly by the bounce. At the same moment, the 50 and 200 EMAs are still sloping down. In that situation, the short-term golden cross is only the result of the rebound, while the trend has not yet reversed.
This trap appears whenever you let short EMAs make the trend decision. When SOL fell to a low of $110 on August 5, 2024 and bounced to around the $159 close on August 25, the 9/21 golden cross appeared. Within the next two weeks, price fell back toward $125. At the time of that signal, the 50 EMA was still declining, down about $2 over 10 bars.
A real trend reversal is confirmed when the EMAs of all periods are aligned in the same direction. Entering just because the shortest pair prints a golden cross often means buying against the larger trend. Waiting until the angle of the 50 and 200 EMAs starts to turn is usually cheaper than paying for false signals.

Three common ways traders misuse EMA
- Using conventional numbers without checking the asset: Just because 9/21 works on one market does not mean it works on yours. If you never run a distribution check, you are trading someone else's average.
- Reading EMA as a single point: Even if price briefly trades below the EMA, a close back above the cloud means the pullback is over. Using a point break as the stop gets the trade closed by normal noise. EMA is meant to be read as a zone and a close.
- Shortening the period without a reason: EMA(9) reacts faster than EMA(21), but it also whipsaws more often. If you use only short EMAs to judge trend, false signals increase sharply. Before reducing the period, define why you need the faster signal.