OptiNod Academy
Elliott Wave Basics Part 1 - What Is Elliott Wave?
Understand Elliott Wave as a recurring structure of five-wave advances and three-wave corrections, and learn the first chart criteria for separating them.
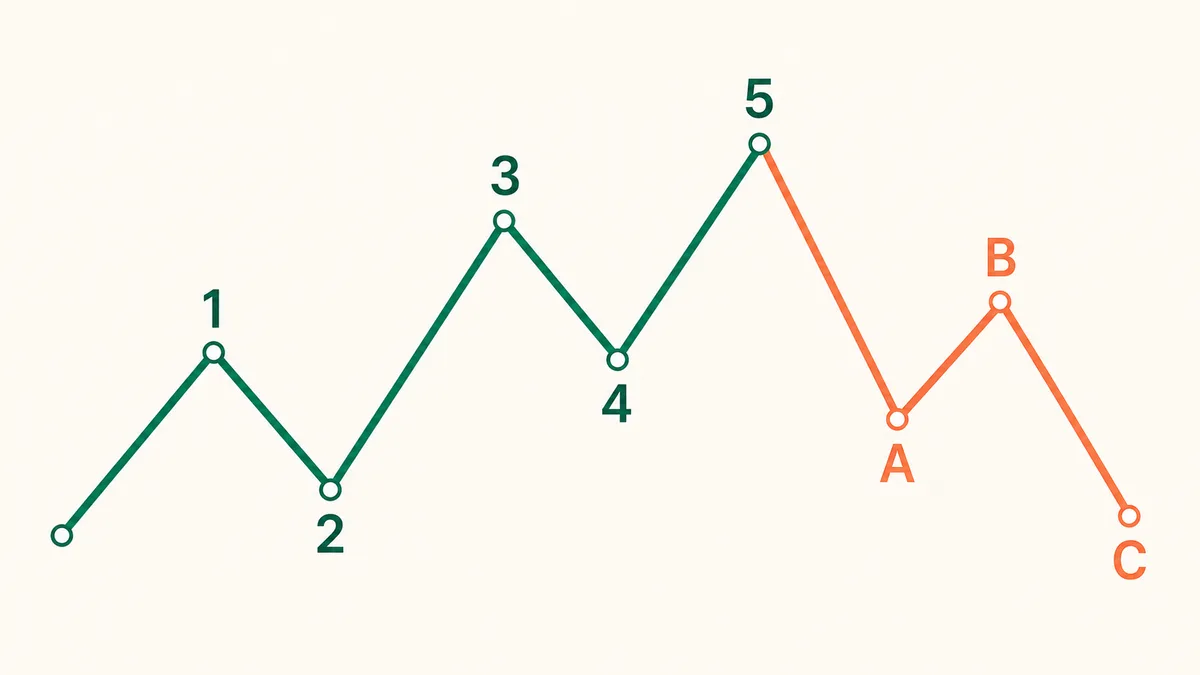
Elliott Wave is a framework for separating the parts of a market that are trending from the parts that are pausing or correcting. Treat it as a way to place neat numbers on a chart and you miss what it is for.
The first concepts to learn in Elliott Wave are the five-wave advance and the three-wave correction. In simple terms, when price moves in one direction, the trend often develops through five moves, then retraces part of that move through three moves.
In an uptrend, waves 1, 3, and 5 move upward. Waves 2 and 4 are pullbacks between those advances, and after the advance ends, an A-B-C correction may follow. In a downtrend, the same logic applies in reverse. Waves 1, 3, and 5 move downward, waves 2 and 4 are rebounds, and the following ABC structure is an upward correction against the prior decline.
The first question to answer is whether price is moving with the trend or retracing the previous move. The wave label comes after that. Without that distinction, it is easy to mistake wave 3 for a correction, or a wave B rebound for a new uptrend.

Waves Should First Be Classified by Their Role
One of the biggest misconceptions in Elliott Wave is treating every move up as favorable and every move down as unfavorable. Even in an uptrend, waves 2 and 4 can fall. Even in a downtrend, waves 2 and 4 can rebound. Direction alone can be confusing, but the structure becomes simpler when each wave is understood by its role.
Impulse waves each serve a different function.
- Wave 1: The first swing that suggests a new move may be starting.
- Wave 2: The retracement that tests whether that first move was genuine.
- Wave 3: Usually the strongest segment, where the market accepts the new direction.
- Wave 4: A pause after a strong move.
- Wave 5: The final push in the same direction.
The ABC sequence is the section that retraces part of the preceding five-wave move.
- Wave A: The first move that breaks the existing trend.
- Wave B: A move that retraces part of wave A. When the correction follows an advance, wave B is a bounce.
- Wave C: A further leg of the correction.
This is why assuming the correction is over after wave B alone can easily lead to a bad call.

A Smaller Five-Wave Structure Can Exist Inside One Larger Five-Wave Move
Elliott Wave repeats across multiple timeframes. A large advance that looks like wave 3 on the daily chart may contain a smaller 1-2-3-4-5 structure on the hourly chart. This is why it is possible to label waves almost anywhere on a chart, and also why the method can become confusing so quickly.
At the beginner level, it is better not to count every timeframe at once. First, the higher timeframe separates whether the market is trending or correcting. The lower timeframe is then used only as a supporting tool for entry timing.
For example, if the daily chart is a candidate for an upward wave 3, a small five-wave decline on the 15-minute chart may be a pullback inside the larger trend. By contrast, if the daily chart is a candidate for an exhausted wave 5, the same 15-minute decline carries more weight as an exit signal. Wave size and position are checked together.

Elliott Wave Should Be Managed With Invalidation Levels
To use Elliott Wave in trading, decide “where the idea is wrong” before asking “how far it can go if it is right.” Wave counts can keep changing in real time. On historical charts they may look obvious, but during live trading, one new candle can overturn the entire scenario.
Invalidation does not need to be complicated. For a candidate bullish impulse, the first criterion is whether wave 2 holds the starting point of wave 1. If wave 2 closes below the start of wave 1, that bullish impulse scenario is discarded.
In an orthodox impulse, wave 4 must not overlap wave 1's price area. Diagonals are kept separate. If the buy was taken because the ABC correction looked finished, that call is dropped the moment price breaks the wave C low again.
If you start by assigning numbers, your stop loss tends to come late, and losses get explained away with phrases like “it could still be wave 2” or “it could be a complex correction.” Good Elliott Wave analysis leaves a clear price where the count must be invalidated.
This is a candidate five-wave advance.Reference prices: wave 1 start at 80, wave 1 high at 100, wave 2 low at 88If price closes back above 100, it becomes a wave 3 candidate.A close below 88 ends the expectation of wave 3.A close below 80 discards the bullish five-wave scenario.

At the Basic Level, Three Distinctions Are Enough
If you try to study extensions, truncations, complex corrections, running flats, and NEo Wave from the start, the chart becomes too complicated. At the basic level, it is better to separate only three conditions clearly: price is in a five-wave advance, price is in an ABC correction, or price is still in an unclear range.
If a five-wave move is in progress, the levels waves 2 and 4 have to hold are checked. If an ABC correction is underway, the check is whether waves A and C move with similar strength, and whether the wave B bounce is being mistaken for the end. In a range, wave numbers are not forced onto the chart.
These three distinctions alone change the trade. In a wave 3 candidate, a pullback buy is the setup being prepared. Midway through wave C, the low is not called early. In a range, the wave count stays on hold until the breakout is confirmed. The first purpose of Elliott Wave is to keep entries out of the wrong part of the chart. It is not a tool for predicting more.
The Next Basic Lessons Cover Impulse and Corrective Waves Separately
The big picture of Elliott Wave is a five-wave advance and a three-wave correction. To use it in practice, however, the two structures need to be studied separately. An impulse is the part of the trend where momentum expands, while a corrective wave is where that momentum pauses or retraces.
Basics Part 2 explains the 1-2-3-4-5 impulse. It covers the role of each wave, why wave 3 matters, and which levels in waves 2 and 4 invalidate the count.
Basics Part 3 explains the A-B-C corrective wave. It covers why zigzags, flats, and triangles behave differently, why a wave B rebound should not be mistaken for the end of the correction, and why traders need to wait for wave C.