OptiNod Academy
VWAP — Volume-Weighted Average Price
VWAP plots the breakeven level for most market participants as a dynamic line, then defines the day’s trend by how long price stays above or below it.
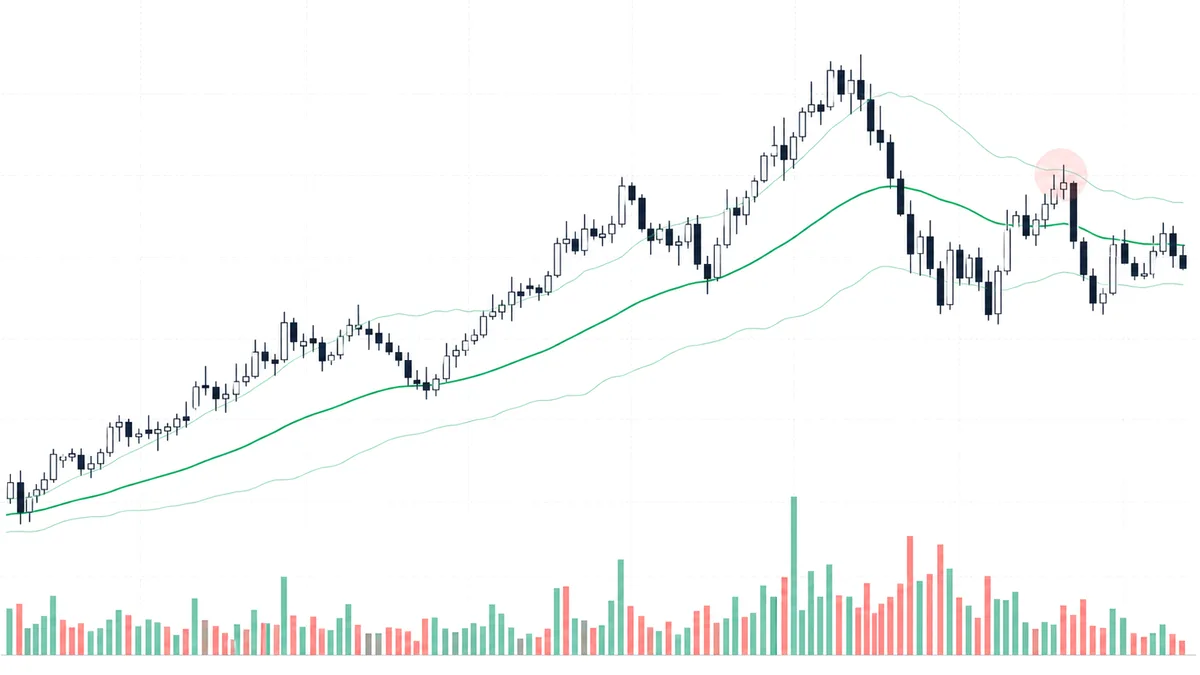
VWAP is the average execution price over a period, weighted by volume. On an intraday chart, it behaves much like the average purchase price for that day’s active participants. If price spends a long time above VWAP, buyers have the advantage. If it spends a long time below VWAP, sellers have the advantage.
The mistake is treating VWAP only as a magnet that price must revert to. In a strong trend session, that view keeps pulling you into countertrend trades. First classify the session by how long price stays above or below VWAP. Then decide whether pullback entries are worth taking or should be avoided.

Time Spent Around VWAP Defines the Session
The first outline shows up in the opening 30 to 60 minutes, and the session’s character firms up after the first two hours. The same VWAP line leads to a completely different trading plan depending on whether price settles on one side of it or keeps crossing back and forth.
If price clearly holds one side of VWAP through the first two hours, it is a trend session. VWAP then acts as dynamic support or resistance, and pullback buys or sells tend to work cleanly. If price crosses VWAP 5 to 7 times in the first two hours, it is a balanced session. In that environment, VWAP acts more like a magnet: when price stretches away, it tends to come back, and mean-reversion trades fit the tape.
The same line becomes the opposite tool depending on the environment. If you ignore the early session and always read VWAP as a magnet, you will keep taking mean-reversion shorts in trend sessions and accumulate losses. In practice, the number of VWAP crosses during the first two hours is the strongest first-order clue for choosing the session’s trading mode.
When ORCL opened with a gap up after earnings in September 2024, price did not trade below session VWAP once during the first 90 minutes. That was a textbook trend session. Pullback buys at session VWAP worked cleanly twice that day. A few days later, the same stock opened on a normal weekday with no major news, crossed VWAP 6 times in the first two hours, and the day rewarded mean reversion around the ±1σ bands.

Standard Deviation Bands — An Institutional Standard Retail Traders Often Miss
Drawing ±1σ and ±2σ bands around VWAP is known as a standard setup on some institutional desks. Most retail charts do not show these bands, but they are what turn VWAP into practical entry and exit levels.
In a balanced session, consider mean-reversion entries near ±2σ: short near +2σ or buy near -2σ to target a return to VWAP. Stops go near ±3σ or the prior candle’s high or low, and profits are taken at VWAP. In this setup, ±2σ marks entry candidates and VWAP is the profit target.
In a trend session, the same bands mean the opposite. Price holding above +1σ for a sustained period within the same session is itself a trend signal, and a candle that closes above +2σ signals trend acceleration. The same ±2σ level flips from a mean-reversion entry line into a trend-entry line.
Traders who do not plot the bands tend to use VWAP in only one mode, as a magnet, and then lose money in trend sessions. They are trading without the lines institutional desks are using to put on trades and manage risk.

Event-Anchored VWAP Extends Beyond Intraday Trading
VWAP’s biggest weakness is that the session start is an arbitrary anchor. Resetting it every day at midnight assumes all participants from before midnight have disappeared. Anchored VWAP, laid out by Brian Shannon in the 2010s, deliberately removes that arbitrariness. It starts accumulation from a meaningful event the market is collectively watching.
Shannon most often used four anchors. An AVWAP drawn from the prior major high becomes the average purchase price of traders who bought near that high, so it acts as dynamic resistance. An AVWAP drawn from the prior major low becomes the average price of buyers near the bottom, so it acts as dynamic support. An AVWAP drawn from a high-volume event, such as earnings, FOMC, or a day when position closes piled up, becomes the breakeven level for capital that entered after that event. An AVWAP drawn from a trend inflection point shows, in one line, which side has had control since that moment.
This is different from intraday mean reversion. AVWAP can remain relevant for weeks or months, continually marking the breakeven level for a large group of participants. If you anchor AVWAP from ORCL’s September 2024 earnings gap candle, price came down to that line three times over the next three months. It bounced the first two times, but the third, in mid-December, closed below the line. Buyers from the earnings gap added to their positions near breakeven the first two times, and on the third the line broke.

Multi-Anchor Confluence — Where AVWAP Becomes a Real Setup
When you draw two or three AVWAPs on the same asset from different events, the price area where they converge becomes the strongest support or resistance.
On the MSFT daily chart, draw one AVWAP from the earnings gap up and another from the quarterly new high.The two AVWAPs converge within 1% of the same price area, for example $410.Price pulls back into that confluence area while the broader trend remains up.Buy the close of the candle that finishes above both AVWAPs in that zone.Place the stop at the closer of that candle’s low and the −1σ line of the lower AVWAP.If price closes below both AVWAPs, the thesis is wrong.The breakeven levels from both events have failed at the same time, so exit quickly.
The key is that the capital breakeven points from two different events are lining up in the same place. A single AVWAP may be an incidental line. When two AVWAPs converge at the same price, the market is paying attention to both events at once. That makes the confluence clearly more reliable than one AVWAP alone.

The Candle That Breaks Below VWAP — The Institutional Stop Mechanism
Some institutional desks are known to use the VWAP of the period they bought in pieces as a stop reference. After a large fund scales in, there are cases where a close below that buying-period VWAP, with price continuing down, is read as the reason for the buy having disappeared. From that point the fund starts closing part of the position. Selling of this kind can come out mechanically under internal risk rules. This article did not measure how large that share is.
That flow shows up directly on the chart. After a candle closes below AVWAP, abnormally large sell volume often appears over the next several days. Multiple desks using the same line as a stop are triggered at the same time. Several funds move at once.
That is why a close below AVWAP is a signal that an institutional stop line has failed. It is more than simple trend weakness. Weakness after that candle can accelerate as institutions unwind positions, so traders should be more conservative with entries or look for short-term short setups.
Once retail traders understand this flow, two things change. First, they avoid bounce entries for 3 to 5 trading days after a candle breaks below AVWAP. The unwind pressure has not fully cleared, so bounces are often short-lived and roll over again. Second, if volume on the candle that closed through AVWAP is at least 1.5 times normal, they treat it as a signal that reduction selling has started to come out one after another.

Where VWAP Loses Meaning
Late in the session, VWAP barely moves. So much data has accumulated that the final hour’s volume has little effect on the line. That is why mean-reversion entries in the final hour often lose their reward-to-risk profile: VWAP is no longer acting as a moving magnet.
Session definition can also break the signal. In 24-hour markets such as crypto, the session start varies by platform. A VWAP based on midnight UTC and one based on the U.S. market open can produce different lines at the same moment. Check your platform’s standard and use it consistently. AVWAP is more stable in 24-hour markets because it deliberately removes that arbitrary session anchor.
In low-volume assets, one or two large prints can move VWAP sharply. AVWAP is most meaningful in assets such as BTC, ETH, SPY, QQQ, and large-cap blue-chip stocks. Reading AVWAP as an institutional breakeven level in other assets can create meaning that is not really there.
Two Conditions Need to Line Up
To trust an AVWAP setup, two conditions should appear together.
- Multi-AVWAP confluence: When an AVWAP from the prior high and an AVWAP from an earnings gap converge at the same price area, the market is watching the capital breakeven levels from two different events at once. That line is stronger than a single AVWAP.
- Volume confirmation: If volume is normal when price touches AVWAP, treat it as a normal pullback. If volume expands sharply, price may break that AVWAP. A forceful break by large capital often shows up in volume before the line fails.