OptiNod Academy
SMA — Simple Moving Average
Do not treat the 200-day line as a simple trend filter. Judge trend strength by how price moves through it.
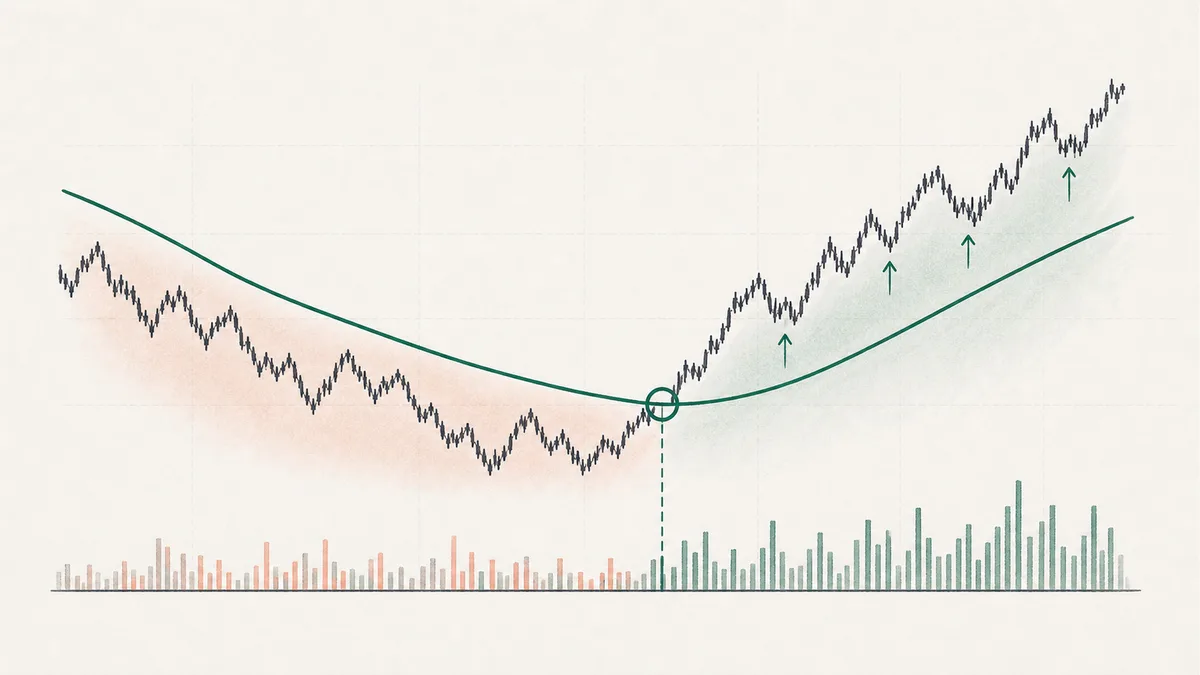
One line says that price above the 200-day line is a bull market and price below it is a bear market. Another says that a golden cross means buy. Most writing on SMAs circles around those two ideas. If one line could separate bullish from bearish conditions that cleanly, the market would move around the 200-day line alone. Real charts do not behave that way.
What matters is how price gets through the line. In January 2023, SPY closed above its 200-day line (about $397), and on pullbacks in late February to early March and late September to early October of that year, the low came down to the area around the 200-day line while the close stayed above it. By contrast, in March-April 2022, SPY's close moved back and forth across the 200-day line (about $446-448) six times. After April 8 it never got back above the 200-day line, and price fell to that year's October 13 low of $348. The same 200-day line produced opposite outcomes in the same asset.
This difference changes how you should use the SMA. First classify how price crossed the 200-day line. Only after the pattern is clear should you consider an entry. If you trade only based on whether price is above or below the line, without reading the crossing pattern, the same tool will keep producing inconsistent results.

Golden Cross Backtests Are Weaker Than the Media Suggests
If you run the numbers on the 50/200 golden cross yourself, the result looks different from the media narrative. On the SPY daily chart (1993-2025, 15 golden crosses and 15 death crosses), the average 30-trading-day return after a golden cross is about +2.6%, and the average 30-trading-day return after a death cross is about +2.3%. The gap between the two is small, so it is a signal with weak power to separate direction, and it is not strong enough to use as a standalone entry trigger.
The more important issue is how often golden crosses reverse. Of the 14 SPY 50/200 golden crosses between 1993 and 2025 that later reversed into death crosses, only one reversed within a month (the December 17, 2015 cross, 15 trading days later), and the rest held for several months to several years. In BTC and ETH, the noise is even greater. It is common to find periods where the average one-month move after a daily 50/200 cross is not statistically distinguishable from the average move in other periods.
Once you accept this, how to use the golden cross becomes clear. Golden crosses and death crosses are direction markers that show which way the trend points now, and the entry is judged separately. The gap in average returns just above is small. Halving buy size while a death cross is in force is an operating choice meant to reduce losses taken where declines cluster, not a response to that return gap. This article does not separately compare the maximum drawdown of the two regimes. The exact entry is set by price structure and the crossing pattern.

First Identify Assets Where the 200-Day Line Works
For the 200-day line to act as dynamic support or resistance, enough market participants must be watching that price area. In assets with heavy institutional participation, such as SPY, QQQ, and large-cap blue chips, the area around the 200-day line often becomes a clean pullback zone. In small-cap altcoins or assets with fragmented participation, the 200-day line is often just another number.
The test is simple. Open one to two years of daily candles for the asset and mark the points where price corrected toward the 200-day line. If there were three or more clear bounces, treat the 200-day line as active in that asset. If there were two or fewer, be skeptical. SPY usually tests the 200-day line about once per quarter, and many of those tests produce clean bounces. During AAPL's 2023-2024 uptrend, the 200-day line also acted as dynamic support several times, in October 2023, January-February 2024, and May 2024. By contrast, small-cap altcoins often move above and below the 200-day line every week.
Using the 200-day line as the core setup level without this check means you are relying on statistics that have not been confirmed in that asset.

Crossings Fall Into Three Patterns
Once an asset passes the 200-day-line effectiveness check, the next step is to classify the crossing pattern.
- Breakout pattern: Price clearly moves through the 200-day line with one or two large candles, then holds its daily closes above the line for several days. If volume expands as well, the 200-day line is more likely to act as dynamic support later. A representative example is SPY closing above its 200-day line (about $397) in January 2023, then becoming a bounce zone near the 200-day line on pullbacks in late February to early March and late September to early October.
- Chop pattern: Price alternates above and below the 200-day line for several days at a time. It closes above the line, then falls back below it the next day. If this pattern continues for more than two weeks, the 200-day line has effectively lost meaning in that asset. Entries based only on the crossing signal usually end in stop-outs.
- Repeated-test pattern: Price establishes itself above the 200-day line, then pulls back two or three times and bounces from that area. Once this pattern develops, the 200-day line becomes a dividing line the market has accepted.
Even when price crosses the same line, different patterns lead to different follow-through. Entering before the pattern is defined is closer to an uncertain probability game than a structured trade.

The Third Pullback Is the Strongest
When an asset where the 200-day line works crosses it with a breakout pattern, then builds a history of two pullback bounces near that line, the third pullback is the strongest entry area.
Six weeks have passed since SPY’s daily chart crossed the 200 SMA in a breakout pattern.Price has pulled back twice toward the 200 SMA and bounced from that line both times.On the third pullback, price touches the area around the 200 SMA.If that candle closes above the 200 SMA, enter long at that candle's close.Place the stop below the prior pullback low.If price clearly loses the 200 SMA on a closing basis, treat the setup as invalid and exit.
The first pullback comes before you can confirm whether the crossing was real. Even after the second bounce, there is still room to call it coincidence. When the same reaction appears at the same area for a third time, it becomes evidence that market participants have accepted that price as a dividing line. This setup only matters when the asset has already passed the 200-day-line effectiveness check.

Where SMA Is More Accurate Than EMA: Long-Term Closing-Price Distribution
EMA gives more weight to recent prices. Most of the time, that makes EMA the faster and more useful tool. There is one exception. When you need to read the long-term distribution of closing prices, SMA's equal weighting is more accurate.
The 200-day line is one of those cases. The 200-day line represents the market's average agreed trading price over the last 200 trading days. That assumption gives equal weight to a trade from 200 days ago and a trade from yesterday. The 200 EMA gives more weight to yesterday's price, so it is more affected by recent volatility. The 200 SMA absorbs that volatility and shows the center of the closing-price distribution.
For marking the psychological dividing line of a long-term trend, SMA is more stable than EMA. If you plot NVDA's 200 EMA and 200 SMA together, the 200 EMA sits about 5-10% above the 200 SMA during bullish phases. That is why two-step pullbacks often appear: price pauses at the 200 EMA first, then pauses again at the 200 SMA. Shallow pullbacks stop at the EMA. Deeper pullbacks stop at the SMA.
Once you understand this distinction, the reason to use both lines becomes clear. The 200 EMA is the current trendline. The 200 SMA is the historical dividing line. Both use the number 200, but they reflect different parts of price history.

The Arbitrary Nature of 200 Trading Days
Two hundred trading days does not precisely match one year in the U.S. stock market. Excluding weekends and holidays, U.S. stocks trade about 252 days per year, so 200 is a shorter, conventional long-term line. In 24-hour crypto markets, there are no days off, so 200 candles equal roughly 200 calendar days. This covers about seven calendar months, a shorter elapsed period than 200 U.S. stock trading days. To compare equivalent periods across assets, you need to adjust the lookback itself.
On a BTC daily chart, one year is about 365 candles. If you use 200 unchanged, you are looking at a roughly seven-month line in BTC. Unless you recalculate one year according to each asset's trading calendar, the same number, 200, points to different time spans across assets.
To compare roughly one-year windows, match about 252 trading days for SPY with about 365 daily bars for BTC. The SPY 200-day line (about 9.5 months) and the BTC 200-day line (about 6.5 months) share the name only, and the lengths differ.

Four Places Where the 200-Day Line Loses Meaning
- Entering before the pattern is defined: The first one to two weeks after a cross are a gray area. The pattern has not yet been established. Do not use the 200-day line as a setup level until the chop pattern has ended.
- Death-cross sell signals arrive late: By the time a death cross appears, price has already fallen a large distance between the 50-day and 200-day lines. If you use it as a sell signal, you exit only after absorbing a large part of the loss. Price structure, such as a break below the prior swing low, identifies a bearish phase earlier.
- A zone where the Volume Profile is empty: The 200-day line works as psychological support only when real volume has built up at the price area it passes through. If the 200-day line passes through a price area with an empty volume distribution, that level is only a number on the chart.
- When sector and macro conditions diverge: Even if an individual stock is above its 200-day line, pullbacks can deepen if its sector ETF or SPY is weak. NVDA's clean 200-day-line setups were concentrated in periods when QQQ was also strong. If you trade from one stock's 200-day line alone, you may be betting without seeing broader market weakness.