OptiNod Academy
The Drawdown Recovery Math — Lose 50% and You Need 100% Just to Break Even
Loss rate and recovery rate are not symmetric. The deeper the drawdown, the faster the return needed to get back to even accelerates. Under compounding, controlling deep drawdowns is your number-one lever.
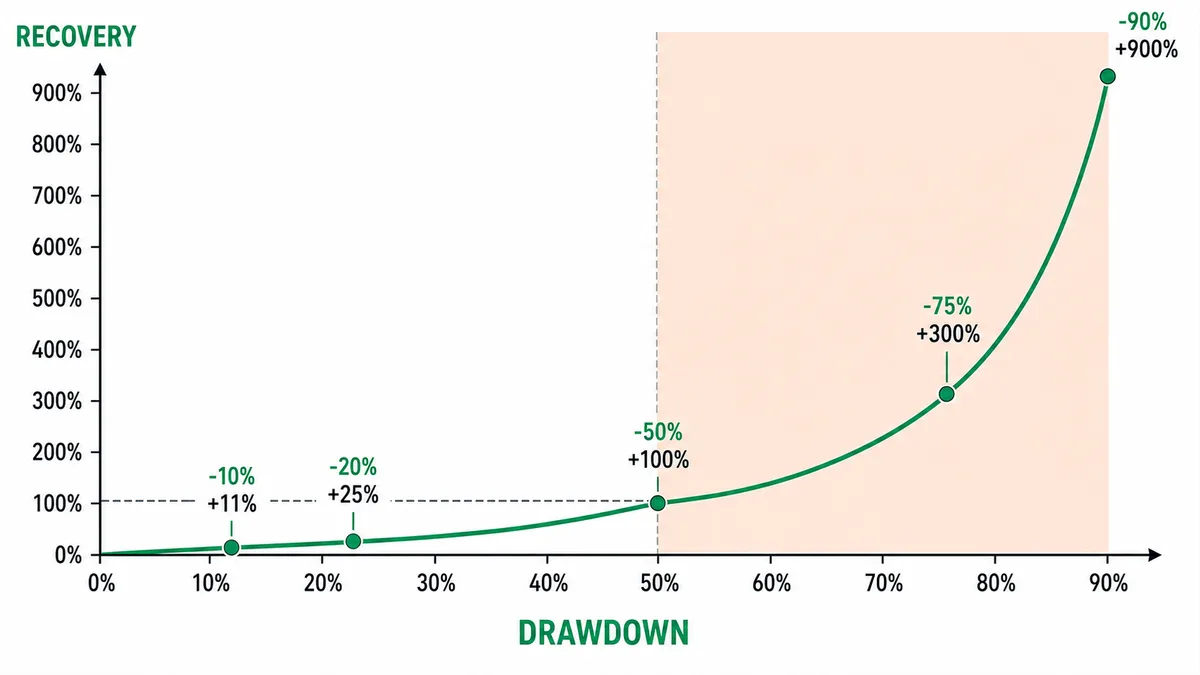
Loss rate and recovery rate are not symmetric, so losing 50% means you need 100% just to get back to even.
The return needed to climb out of a drawdown back to break-even is fixed by one line of arithmetic. The recovery return = 1/(1−DD) − 1, where DD is the drawdown from the high. Each time the drawdown deepens by another 10 percentage points, the return required to recover grows by more in the deeper part of the curve.
| Drawdown (DD) | Return needed to break even |
|---|---|
| −10% | +11.1% |
| −20% | +25% |
| −33% | +50% |
| −50% | +100% |
| −75% | +300% |
| −90% | +900% |
Most people read this math as "just make back what you lost." You lost 30%, so a 30% gain puts you back where you started — that is the intuition. The reason it is wrong is that the denominator shrinks. When 100 gets cut in half to 50, the recovery from there is calculated off the reduced base of 50. For 50 to climb back to 100, it needs to rise by 100% of 50. Even when you lose the same dollar amount, the road back is far steeper.
This asymmetry matters in practice because one large drawdown wipes out several small gains stacked up before it, all at once. After this, a chart shows both "how much can I make this time" and "in the worst case, how far does it get cut." The second question comes first. At entry, expected return is not the only number. The chance of a deep drawdown is the first thing money management handles.

Recovery costs grow faster as drawdown deepens
Recovery is drawdown / (1 − drawdown), so its rate of increase grows as losses deepen. −10% needs +11.1%, −20% +25%, −50% +100%, −60% +150%, and −75% +300%. There is no sudden threshold at 33% or 50%. Equal ten-percentage-point drops add more recovery burden at deeper levels, but the burden does not double every time.
This acceleration happens because the denominator keeps getting smaller. If capital is cut in half, the remaining half has to double. If it is cut to a quarter, the remaining piece has to quadruple. A loss can look like a steady percentage decline, but the return needed to recover steepens as the drawdown deepens. It is not an exponential function that exactly doubles at every step.
On March 14, 2024, BTC hit a then all-time high of $73,777. On August 5 of the same year, the yen carry unwind shock dragged it down to a low of $49,000 — about −33.6% from the high. By the math, that was a drawdown requiring +50.6% to break even. If you figured "I lost 33%, so a 33% gain fixes it," you set your break-even line 17 percentage points too low. When you look at a −33% level on the chart, it is more accurate to read it as already carrying a +50% recovery task.

A Single Large Drawdown Erases All the Small Gains Ahead of It at Once
Compounding builds by multiplying returns. So if any one return is heavily negative, the positive gains earned before it get carved away all at once. The seven gains in the figure are the case where stacking +10% and then taking a −50% nearly wipes the profit. Five times, capital grows to about 1.61×, and one −50% after that drops it to 0.80×, below the starting point. Winning small five times cannot cover losing big once.
Because of this math, maximum drawdown turns from a result number you check after the fact into a variable that constrains compounding in advance. Even when the average return is the same, a different drawdown path splits the final capital. A more volatile curve, even with the same average return, loses capital in the deep-dip stretches and ends with a lower final balance.
On November 10, 2021, BTC printed a high of $69,000, then fell to a low of $15,476 during the FTX collapse in November 2022. That is about −77.6% from the high — a drawdown needing roughly +346% to break even. For someone simply holding, it was just a violent swing in price, but for an account that amplified the drawdown with leverage or averaging down, that same −77% leads to liquidation or an unrecoverable hole. For the same price action, whether the account survived or ended came down to where the drawdown was stopped.
To Grow Compounding, Stopping Deep Drawdowns Comes First
Because the recovery curve is asymmetric, growing an account over the long run means cutting deep drawdowns first. Volatility targeting or smaller entry sizing lowers your average return a little. But if you cap a drawdown that would have reached 50% or 75% at 30% or less, the return needed to recover drops from 100% or 300% to under +43%, and over the long run this account ends up larger.
The principle lives in the shape of the curve itself. Reducing a drawdown from −50% to −30% lightens the recovery task from +100% to +42.9% — more than half. The same 20 percentage points cut far more recovery burden when taken off the deep end. Adjust your position sizing to volatility so the number of large losses drops, and you never descend into the stretch where the curve turns steep.
On May 19, 2021, BTC crashed about −31% in a single day, from a high of $43,585 to a low of $30,000. In a market that can produce −31% in one bar, betting your entire capital at once means you eventually descend into the very stretch from which recovery is hardest. For the same signal, cutting your entry size in half turns that day's −31% into −15.5% for the account, and brings the recovery task down from +45.3% to +18.3%.
A Setup That Sizes Entries to Volatility to Reduce Deep Drawdowns
The idea is to shrink entry size as volatility rises so that deep drawdowns never occur in the first place.
- Sizing basis: Fix the loss on a single trade at 1% of the account. When the stop distance is
2xATR, the position quantity = (account × 1%) ÷ (ATR × 2). - Volatility cap: If ATR% exceeds
1.5xthe median of the prior 90 days, cut the calculated quantity by a further 50%. In a market where volatility jumps sharply, this slows how fast the account shrinks. - Drawdown brake: When the account's drawdown from its high reaches −15%, halve the size of all new entries; when it reaches −25%, stop new entries. This cuts off the path down toward −50% in advance.
- Entry invalidation: If one signal bar's range (high minus low, true range) exceeds
2xATR, the volatility premise used to size the entry is broken, so skip that signal. ATR is an average of many bars, so it rarely doubles on a single bar.
These numbers are all set to hold the recovery curve in its shallow region. Stop the drawdown at −25% and the return needed to recover falls to +33.3%, a level you can comfortably make back.
The Recovery Math Only Holds for an Account That Avoided Liquidation
The recovery math only holds on the premise that the account survives and gets a chance to recover. Use leverage and you get liquidated before you ever reach −50%, so the chance to recover disappears entirely. That is why drawdown control has to be reviewed as one package with risk of ruin.
- Even in the worst case (a single-bar −31% move), does the forced-liquidation line sit outside the stop line?
- When the account drawdown reaches −15% / −25%, does the rule that reduces sizing trigger automatically?
- Is the combined correlated exposure of concurrently held positions low enough that they will not collapse together under a single shock?
- With the volatility cap and drawdown brake applied, does the curve's maximum drawdown stay within −30%?
When all four items are checked, that account's recovery task is held within +43%. The asymmetry between loss rate and recovery rate is arithmetic you cannot change, so the one thing we can set is the single question of how far down we let the account fall.
