OptiNod Academy
Correlation and Exposure: Why More Coins Do Not Always Mean Diversification
Holding five altcoin longs is often five bets on the same BTC move. This article explains how to assess total exposure by asset class and direction.
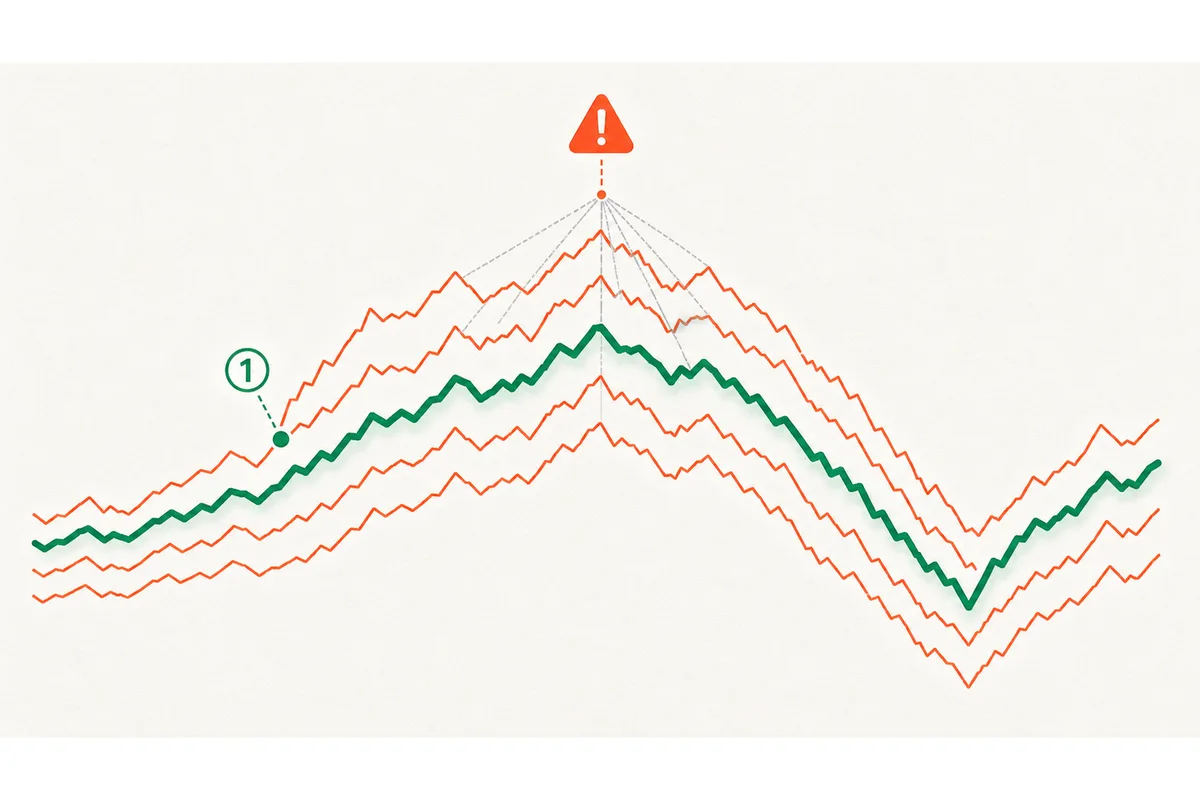
More positions do not guarantee diversification. Positions tied to the same direction and same asset class may look spread across multiple tickers, but they are still one bet.
Correlation is a single number, from -1 to +1, that shows how closely two assets’ returns move together. It is calculated by dividing the covariance of the two return series by the product of their standard deviations. A correlation of +1 means they move perfectly in the same direction. -1 means they move in exactly opposite directions. 0 means one asset’s move tells you nothing about the other’s. The basic logic of diversification sits inside this number. When you hold assets with low correlation, one asset can help offset another when it falls, reducing overall volatility.
Most traders skip this number and simply count tickers. If they hold five altcoin longs, they feel five times more diversified than if they had put everything into one coin. The intuition is that five assets split the risk five ways. But if all five move in the same direction with BTC, only the names are split. The bet is still one bet.
Several longs in the same direction and the same asset class do not become diversified just because there are more tickers. Long five altcoins and you have five names, but one bet: that BTC goes up. The size of that bet is the notionals and volatilities of the five positions added together. Aggregate exposure by asset class and direction.

Five Altcoin Longs Are One BTC Bet
When you hold several highly correlated assets, the effective number of positions moves closer to 1. This is not just a feeling. It comes directly from volatility math. If you hold N assets at equal weights and the average pairwise correlation is ρ, the actual number of independent bets is N / [1 + (N−1)ρ]. If the average correlation is 0, five assets behave like five independent positions. If the average correlation is 0.7, five assets give you only 1.32 independent bets. At 0.8, that drops to 1.19.
Real numbers support this. Using daily log returns for 2024, BTC’s correlation with major altcoins was 0.798 for ETH, 0.746 for SOL, 0.781 for DOGE, 0.699 for AVAX, 0.670 for ADA, and 0.642 for BNB. ETH and SOL were also highly correlated at 0.699. Correlations with BTC alone do not give the average correlation among the altcoins. Altcoin-to-altcoin correlation has to be calculated separately, but if you take that average as 0.7 — an assumption that it sits near the numbers above — five equal-weight, equal-volatility names correspond to about 1.32 independent bets.
The key point is that splitting capital across five names does not split risk five ways. Risk is determined by how similarly that capital moves. The number of line items has little bearing on it. On a day when BTC falls 5%, five altcoins with 0.7 to 0.8 correlation will almost always fall with it. If you expected the losses across those five names to offset one another, that expectation was flawed from the start. A screen with five position rows may look diversified, but in exposure terms it is one BTC long.
In a Crisis, Correlations Converge Toward 1
The moment you need diversification most is when the market breaks down. Yet that is exactly when correlations tend to rise toward 1 and diversification disappears. In normal markets, each asset has its own catalysts and flow, so correlations can be somewhat lower. When fear takes over, all risk assets are sold as one block. Traders stop evaluating individual fundamentals and focus on cutting risk.
The LUNA-UST collapse in May 2022 shows this clearly. In the relatively calm period from February to March before the collapse, BTC’s daily return correlation was 0.915 with ETH and 0.650 with XRP. But from May 5 to June 20, as the collapse spread, BTC-ETH correlation rose to 0.930, and even XRP, one of the lower-correlation assets at 0.650 in normal conditions, jumped to 0.797. Assets that had moved somewhat independently in calmer markets were dragged down together with BTC during the crisis.
The daily moves make the point even clearer. On May 11, 2022, BTC fell 6.2% on a closing-price basis, while ETH fell 11.0%, SOL fell 23.9%, AVAX fell 30.1%, ADA fell 17.5%, and DOGE fell 21.0%. The direction was the same across the board, and the altcoins fell more than BTC. An account holding five altcoin longs lost more that day than an account holding only BTC. The trader aimed for diversification, but in the crisis the losses were amplified instead. If you take comfort from normal-market correlations alone, you will be exposed when the largest losses arrive.

Real Diversification Comes Only From Low or Negative Correlation
Diversification becomes more effective as correlation falls, and especially when correlation turns negative. If correlation is 0, one asset’s loss can, on average, be offset by another asset, reducing total volatility. If correlation is close to -1, one asset rises when the other falls, directly cushioning the loss. The word diversification only really applies to combinations built on low or negative correlation.
The problem is that low correlation is hard to find inside the same asset class. Altcoins, by definition, tend to move like satellites of BTC. Adding more altcoins rarely takes correlations out of the 0.6 to 0.8 range. Truly low correlation usually appears when you cross asset classes. Crypto and U.S. Treasuries, crypto and gold, or long positions paired with inverse hedges are examples where the underlying drivers differ enough for correlation to fall and diversification to work. Adding more names inside the same risk-asset bucket is fake diversification. Combining assets driven by different forces is real diversification.
One common misunderstanding is worth clearing up. Diversification does not increase expected return. It lowers volatility for a given expected return. When you combine low-correlation assets, the size of large losing days tends to shrink, preserving capital for the next trade. An account diversified only across altcoins may look diversified in normal markets, but in a crisis its volatility can hit all at once. It gets no protection precisely when volatility reduction matters most.
Multiple Strategies Are Also One Bet If They Use the Same Signal
The same trap applies when traders try to diversify by strategy instead of by ticker. Running three trend-following strategies at the same time may feel like splitting risk three ways. But if all three are just slightly different versions of the same trend signal, they will enter in the same direction at roughly the same area and stop out around the same area. There are three strategy names, but only one bet.
The way to check this is to look at the correlation between strategy equity curves. Treat the daily P&L of two strategies like return series and calculate the correlation. If it is above 0.8, the two strategies are effectively receiving the same signal twice. For example, a 20-day moving average breakout strategy and an upper-channel breakout strategy may appear to have different entry rules, but in trending markets they often enter on nearly the same candles. In sideways markets, they often get hit by whipsaws in nearly the same places. That is why their P&L curves are highly correlated.
To diversify across strategies, you need strategies whose equity curves make and lose money at different times. Trend following tends to make money in trending markets and lose in sideways markets. Mean reversion tends to make money in sideways markets and lose in trending markets. Their P&L correlation is low or negative, so one can earn while the other struggles, smoothing the overall curve. Running multiple versions of the same signal may look like diversification, but it only increases the size of the same bet.

Total Exposure Should Be Viewed by Asset Class and Direction
All of these traps come from missing one basic check: looking at exposure only by ticker, when it should be aggregated by asset class and direction. A screen with five positions may look diversified, but if all five are crypto longs, the asset-class exposure is one line. To see the real risk, you need to group assets that move similarly and evaluate them together.
The process is simple. Group positions by how strongly they correlate with BTC, then add the notional value of each group and write it on one line. If you hold five altcoins, do not treat them as five separate rows. Aggregate them into one crypto-long line and check what percentage of the account that total represents. Each altcoin may be only 10% of capital, making each single-name risk look small. But together, they are a 50% crypto-long exposure. That is the real exposure. If you also hold BTC and ETH, the exposure is even larger.
Direction matters too. Longs and shorts inside the same asset class can partially offset one another, but if everything is long, the exposure simply adds up. Even if you intend to hedge, a BTC long paired with an ETH short, where the two assets have 0.8 correlation, can offset their common movement when volatility and position sizes are matched, but their independent movement remains unhedged. A correlation of 0.8 does not mean that 80% of the risk is eliminated. When you aggregate exposure by asset class and direction, accounts that feel diversified often turn out to be heavily concentrated in one direction.

Total Exposure Checklist
The gap between the feeling of diversification and actual exposure becomes obvious when you rewrite your positions using the following checks.
- Asset-class aggregation: Group positions with BTC correlation of 0.6 or higher. Write the total notional value of the crypto-long bucket as one percentage of the account. If this percentage exceeds your single-position limit, such as 25%, you are overexposed to one trade regardless of how many tickers you hold.
- Effective number of positions: With equal weights and volatilities, 5–8 assets at average pairwise correlation 0.7 give about 1.32–1.36 effective bets. Higher correlation reduces that count. Check pairwise correlation and risk sizes before adding tickers.
- Directional net exposure: For each asset class, calculate net exposure by subtracting short notional from long notional. Net exposure cannot be larger than that bucket’s total notional, so if it exceeds the bucket limit in the example above (25% of the account), treat that direction as concentrated.
- Crisis-correlation assumption: Even if normal-market correlation is 0.6, expect it to rise sharply in a crisis. In this article’s May 2022 window, XRP rose from 0.650 to 0.797 and ETH rose to 0.930. Do not generalize that every altcoin exceeds 0.9. Estimate the maximum loss on the assumption that the names in the bucket fall together.
Once you write these four lines, the real exposure usually collapses from many ticker rows into one or two asset-class lines.
Correlation Changes Over Time
The crisis observations reported here are BTC-ETH 0.930 and BTC-XRP 0.797. They do not establish that all altcoins converged above 0.9; calculate crisis correlations for the assets actually held.
That is why correlation should be viewed as two numbers: normal correlation and crisis correlation. Normal correlation can be calculated using roughly the most recent 90 days of daily returns. Crisis correlation should be calculated separately over short historical selloff windows, such as the May 2022 LUNA collapse or the May 2021 China regulation selloff. When judging whether diversification will actually work, it is safer to use crisis correlation. In normal markets, diversification is not under real stress. Diversification truly matters during crises.
Viewing correlation and exposure this way changes how you read a portfolio. Each time you add a ticker, you first check how closely the new asset moves with the existing group before assuming it adds diversification. If correlation is above 0.7, the asset does not add diversification. It only increases the weight of the existing bet. Only when correlation is below 0.3 or negative does it add real diversification to the account. Replacing the habit of counting tickers with the habit of checking total exposure and crisis correlation is how you avoid believing you are diversified while putting everything on one trade.