OptiNod Academy
ATR — Average True Range
When ATR is at least twice its 30-bar average, reduce position size to keep R-risk constant.
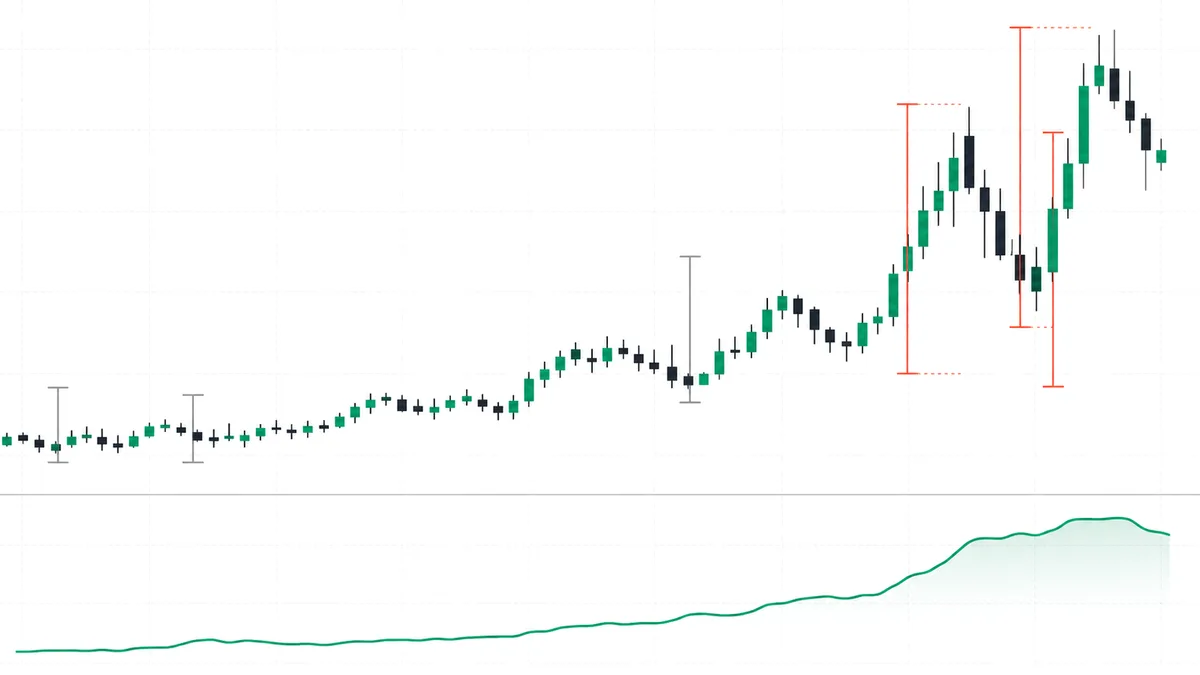
ATR sets both your stop distance and your position size. On high-volatility days, you need to reduce size even if the entry setup is the same. If ATR is twice its normal level and you keep the same size, the money you lose on one stop, R, also doubles.
ATR(14) is calculated with Wilder smoothing, which uses a different formula from a simple 14-bar average. When one high-volatility bar appears, its effect does not disappear immediately. It remains in the ATR for several bars. ATR therefore captures not only current volatility, but also the aftershock of a recent volatility spike.
The basic use is simple. Set stop distance as ATR × k and keep R fixed. When ATR rises, the stop distance widens, so position size must fall. If you only widen the stop without reducing size, account risk changes every time, even on the same setup.

R per ATR — The Core of the Sizing Formula
If you fix risk per trade (R), usually 1% of the account, and set the stop distance as ATR × k, position size is naturally determined by dividing R by the stop distance. When volatility doubles, the stop distance also doubles and size is cut in half. That keeps R constant regardless of volatility.
This simple formula creates a system that adjusts automatically to volatility. Whether ATR rises or falls, the loss amount stays at the same level. A trader who always uses the same size, by contrast, can take two or three times the normal loss in a single trade when volatility expands.
Natural gas daily ATR moved from 0.10 to 0.30 during 2024. A trader who used the same size at ATR 0.30 as at ATR 0.10 took almost three times the loss on the same 2 ATR stop. To keep the same R when ATR is 0.30, size has to come down to about one third of the size used when ATR is 0.10. If you do not put that difference into the size, you do not keep the same R.

ATR at 2× the 30-Bar Average — The Half-Size Trigger
After fixing the stop-distance multiple inside your system, such as k=2 or k=3, the next question is when to reduce size further. The simplest rule is to divide current ATR by the average ATR over the previous 30 bars.
- Ratio 0.7–1.3: Normal range. Use normal size and normal R.
- Ratio 1.3–2.0: Volatility is expanding. Set the stop from the current ATR and size falls to 1 divided by the multiple on its own, so R stays the same as usual. If ATR is 1.5 times normal, size is about 65%.
- Ratio 2.0 or higher: Volatility has exploded. Set the stop from the current ATR and size is already 1 divided by the multiple — about 50% at 2.0 times — so R stays the same as usual. Cutting further means lowering R itself. One loss can take a month's worth, so lower R to 25–40% of normal, or hold off on new entries.
- Ratio below 0.7: Volatility is contracting. A stop that is too tight can be hit by normal noise. If you widen the stop from ATR 2 to 2.5 or 3, reduce position size accordingly to maintain your usual R.
WTI crude oil daily ATR surged in March 2022 after Russia’s invasion of Ukraine, reaching 7.9 dollars on March 9, or 2.2 times the previous 30-bar ATR average of about 3.5 dollars. Traders who entered with normal size during that period took large losses. Traders watching the ratio cut size to 30%. Based strictly on the same R, about 45% (=1/2.2) would have been enough, but because this was a volatility spike, they chose a more conservative size.
Account: 10,000 dollars. R = 100 dollars (1%).WTI daily ATR is 7.9, and the previous 30-bar ATR average is 3.5 — ratio 2.2.Stop distance: 2 × 7.9 = 15.8 dollars.Fit R of 100 dollars to the 15.8-dollar stop taken from the current ATR and the size is 100 ÷ 15.8 ≈ 6.3 units. That alone keeps R the same as usual. At a normal ATR of 3.5 dollars and a 7-dollar stop, size is about 14.3 units, so 6.3 units is 1/2.2 of that.Because the ratio is above 2.0, this example also lowers R itself to 30% of normal (30 dollars). Size is then 30 ÷ 15.8 ≈ 1.9 units.If ATR falls back below 5.0 after entry, recalculate the new size using the ATR at that time.
The key is to keep stop distance at ATR × k and control R through position size. If you try to control R by tightening the stop, the stop moves inside normal noise and valid setups keep getting stopped out.

True Range Gap Handling — What It Means Across Asset Classes
True Range uses max(H−L, |H−C_prev|, |L−C_prev|), the largest of the three values. It looks simple, but it produces different results across asset classes.
- Crypto and FX, which trade 24 hours: Gaps are rare, so H−L usually becomes TR. ATR roughly tracks the intraday range.
- Stocks, ETFs, and equity index futures: Overnight and weekend gaps are common, so |H−C_prev| or |L−C_prev| often becomes TR. These are assets where ATR should not be read as intraday movement only, and a single gap can lift the entire ATR.
- Commodity futures such as WTI crude oil and natural gas: Events outside trading hours, such as Middle East news, hurricanes, and EIA inventory reports, are immediately reflected as gaps. For that reason, ATR can mean different things to intraday traders and swing traders even at the same price level.
This difference affects which ATR period to use. In assets with frequent gaps, one large gap affects ATR(14) for the full 14 bars. Extending the length to ATR(30) smooths that impact. In assets like natural gas, where EIA reports can create large weekly moves, ATR(30) is often a more stable reference point.

The Lag Created by Wilder Smoothing
ATR(14) does not simply average the most recent 14 bars. The formula is ATR_today = (ATR_prev × 13 + TR_today) / 14, giving the new TR 1/14 and the prior ATR 13/14. Volatility from further back therefore stays in the value, scaled down, and the structure is in the same family as an EMA.
Two things follow from this. First, ATR reacts slowly. One large bar can push ATR higher, but it will not instantly double it on the spot. Second, the effect of a past large bar remains for a long time. The effect of a large crash bar can remain in ATR over subsequent bars.
One way to compensate for this lag is to watch ATR(14) and ATR(30) together. ATR(14) reflects recent changes more quickly, while ATR(30) shows the broader volatility regime more steadily. When the two values diverge sharply, current volatility is changing quickly.

Fat Tails in ATR Distribution by Asset
The same ratio, such as twice normal, occurs with different frequency depending on the asset. On natural gas daily charts, the ATR ratio goes above 2.0 five to eight times a year. That means large moves far from normal show up often. A distribution like that is called a fat tail. On the SPY daily chart the same event happens only once or twice a year, and in EURUSD it happens zero or one time a year.
This changes re-entry frequency and position-sizing practice. Natural gas traders need to reduce size for volatility often. EURUSD traders may encounter the same condition relatively rarely. Looking at your asset’s ATR distribution once gives you a feel for how rare a 2.0 ratio really is in that market.

Three Places ATR Misleads
- Comparing assets by absolute ATR: You should not compare BTC ATR of 1,500 dollars with ETH ATR of 80 dollars on the same scale. For cross-asset comparisons, use ATR / Price (%) or the ratio versus normal. Natural gas ATR of 0.30 is about 8% of price (based on the late-December 2024 close of 3.63 dollars), while WTI ATR of 2.0 is around 3% of price (2.9% at 70 dollars), meaning natural gas is almost three times more volatile.
- Using ATR as a direction signal: Some traders read rising ATR as a trend-start signal, but ATR has no direction. Volatility can break upward or downward. Direction comes from price structure, trend lines, and momentum. ATR only sets size and stop distance.
- Trusting ATR immediately after a gap: One large gap bar can lift ATR right away, but do not decide immediately whether it reflects a real volatility shift or a one-off outlier. It is safer to wait 3–5 bars after the gap and see whether the ratio holds before changing the sizing policy.
Two Contexts to Check Alongside Position Sizing
For an ATR-based sizing system to work consistently, watch two additional contexts.
- Higher-timeframe ATR ratio: Even if the 1-hour ATR ratio is 1.0, a daily ratio of 2.0 means the market as a whole has entered a high-volatility regime. Use the higher timeframe as the primary reference, and read the shorter candles as secondary.
- Event schedule: Scheduled events such as FOMC, CPI, and EIA inventory reports can change the ATR distribution itself. It is safer to have a separate rule that automatically reduces size during the 24 hours before and after these events. By the time ATR reacts, the large bar has already formed.