OptiNod Academy
Wyckoff Method — A Visual Roadmap of the Nine Schematic Events (Part 6)
The core of a Wyckoff schematic is the time order and volume signature of nine events: preliminary support, selling climax, automatic rally, secondary test, spring, test, last point of support, sign of strength, and backup. The chart can look unlike the diagram and still work when the event order is right.
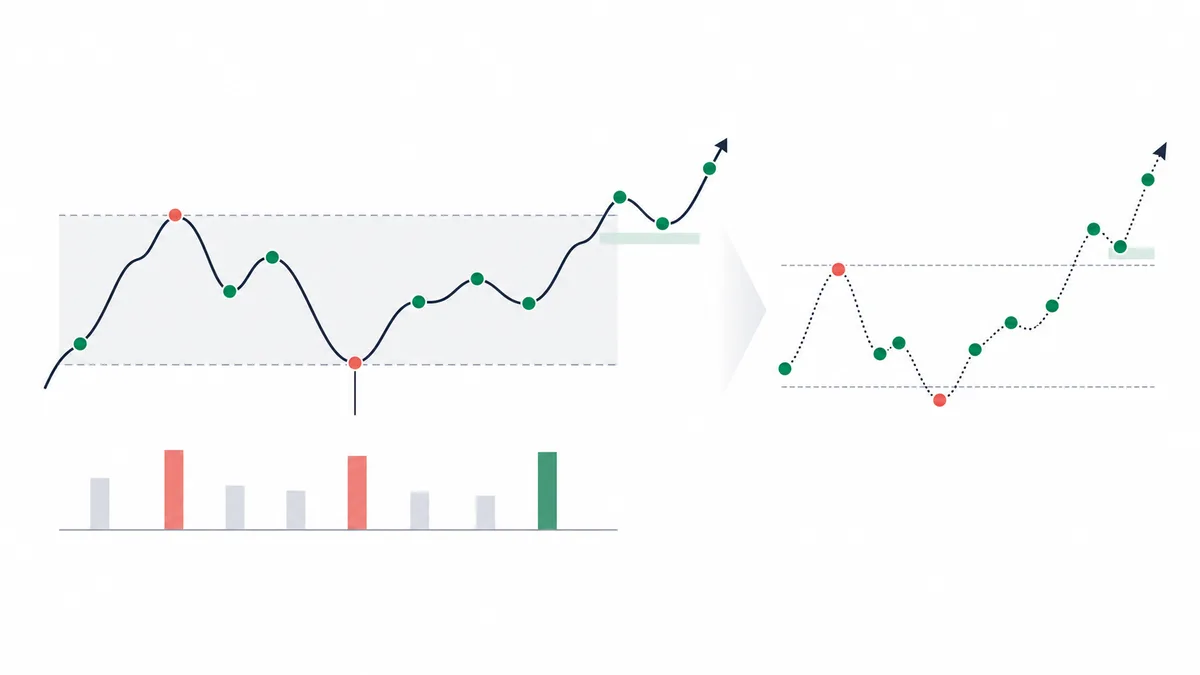
The essence of a Wyckoff schematic is the time order and volume signature of the nine events. The shape of the drawing comes second.
The first five parts covered the three laws and the Composite Operator (large player), the five phases of accumulation, the five phases of distribution and the upthrust after distribution, volume spread analysis and the Weis Wave, and how Wyckoff applies to crypto and algorithmic markets. Part 6 is about how to place all of those tools on one diagram. Wyckoff himself never published a single diagram. The diagrams in textbooks were drawn up for students in the 1940s and 1950s by the instructors who carried the course on after his death, including Robert Evans. The form treated as standard today is the version refined by Hank Pruden and the Wyckoff Institute lineage, now SMI.
Evans laid out two accumulation schematics (#1 and #2) and two distribution schematics, and he placed nine event labels on each one in time order: preliminary support, selling climax, automatic rally, secondary test, spring, test, last point of support, sign of strength, backup, or upthrust, upthrust after distribution, and last point of supply. The diagrams worked because a student could see which events to hunt on a chart, and in which order.
Popular readings flip that visual strength. One side waits for the chart to look exactly like the textbook diagram. The other decides Wyckoff does not work because the chart looks different. Both come from the same mistake. The real value is the order of the nine events and the volume signature that comes with each one. If the event order and the volume line up, the schematic still works when the chart's outline differs from the diagram.

The nine events follow a set order
The accumulation order checked in this article is preliminary support, then selling climax, automatic rally, secondary test, spring, test, sign of strength, and the last point of support inside the backup. A spring can be skipped, and a last point of support can print higher up without a backup back into the range, so do not force all nine events onto every case.
The first four events (preliminary support, selling climax, automatic rally, and secondary test) are the trace that the prior downtrend has stopped. They are Phase A. The top and bottom of the range mean something only after all four have shown up in order.
- Preliminary support: If a selling climax prints alone, with no preliminary support first, that candle is less likely to be a real climax and more likely a large bearish candle in the middle of the trend.
- Automatic rally: If the automatic rally does not appear as the automatic rally right after the selling climax, selling is not exhausted yet.
- Secondary test: If the secondary test breaks the selling-climax low, Phase A is not finished yet.
The middle two events, spring and test, are the core of Phase C. The spring leaves the range low briefly and comes back. The test after it must hold the spring low on dried-up volume. If the order flips, and a candle that looks like the test prints first and a spring-like candle comes after, that is a different signal. A test of the range low before the spring is only ordinary range noise. Entering there while waiting for a spring can meet another leg down.
The last three events (last point of support, sign of strength, and backup) sit on the border of Phase D and Phase E.
- Last point of support: The point where a pullback after the sign of strength confirms support. It can form near the range high, and also above that high.
- Sign of strength: A strong advance with volume. This article checks for a closing break of the range high.
- Backup: After the sign of strength, one more test of the range high, now acting as support.
If a backup prints with no sign of strength, real accumulation in that range may not be finished, and an entry on the backup candle is an easy place to get caught in a whipsaw.
BTC's daily chart built a nine-event sequence near $15,500 in November 2022. Preliminary support printed on June 18, 2022, at a low of $17,622, on 2.2 times the prior average volume. Price then fell further to a low of $15,588 on November 9, and the selling climax printed as a huge bearish candle on 2.4 times the prior average volume. The automatic rally ran to a high of $18,199 on November 10. The secondary test was confirmed on November 21 at a low of $15,476, on volume about 44% of the selling climax. The fast rise in early January 2023 was an accumulation that did not build a separate spring. The sign of strength is the bullish candle on January 12, on 2.8 times volume. It closed through the range high of $18,388 at $18,847. The last point of support formed on January 18 at a low of $20,407. Under this article's strict secondary-test rule, Phase A cannot be called complete on November 21, the day price broke the selling-climax low. This case watched that low as a new range floor, then confirmed the accumulation idea with later higher lows and the sign of strength. It did not declare completion at the secondary test.
Schematic #1 vs schematic #2 — with or without a spring
The two accumulation schematics from this course line split on one point.
- Schematic #1: Includes a spring.
- Schematic #2: Goes straight to the sign of strength, with no spring.
They are two results, split by how early the selling was used up inside the range.
Schematic #1 (with a spring) forms when stop orders have stacked thickly just under the range low during the range. Price dips under that low and takes the stops sitting there. That dip is the spring.
Schematic #1 fits assets that fell hard just before the range, with ordinary participants' stops visibly stacked near the range low. Bear-market bottoms in BTC and ETH usually run as schematic #1.
Schematic #2 (accumulation without a spring) forms when Phase B lasts long enough that stops near the range low are used up little by little inside the range. Several small downside tests (a minor spring or a shake-out) take that stop flow in pieces, so Phase C does not need a separate spring candle.

BTC's November 2022 to January 2023 range ($15,476 to $18,388) is an example. Over nine weeks the lows rose from $15,476 on November 21 to $16,333 on December 30 and to $16,499–$16,605 in early January, and price went straight into the January 12 sign of strength with no spring.
The practical split between the two schematics is how much volume has built at the range low. A volume profile of the range shows it: heavy accumulation volume near the range low is more likely schematic #1, and volume piled at the middle of the range is more likely schematic #2.
Once a range is on the chart, separate in advance the ranges that need a spring from the ranges that can go straight to a sign of strength. That tells you how long to wait.
The point is that neither schematic is a pattern with several of the nine events missing. In schematic #2 a small shake (minor shake-out) still fills the spring's place, and the retest of the range low right after it fills the test's place. The shape is just less obvious. The event clues are still inside the range.

Volume signatures stay consistent when the market changes
Each of the nine schematic events comes with its own volume signature. Candle shape changes with market volatility, but the volume signature comes from how the event works, so it stays fairly consistent when conditions change. Checking the signature is the more accurate read.
The four Phase A events carry these volume signatures. When the four show up in order, Phase A has actually finished.
- Preliminary support: Volume is only a bit above the prior trend's average.
- Selling climax: Volume expands to 2 to 5 times the prior average.
- Automatic rally: This is the automatic rally while selling is briefly exhausted, so volume drops to half of the selling climax or less.
- Secondary test: The same price area is tested a second time, and volume falls to 30–50% of the selling climax.
Spring volume splits two ways.
- High-volume spring: It takes the supply in one pass, on 2 to 3 times the prior average volume.
- Low-volume spring: Selling has already dried up, so it prints on thin volume at or below the prior average.
Either way, the test candle's volume has to be clearly lower than the spring candle's. A second test of the same spot with almost no selling behind it is solid evidence that accumulation is finished.
The volume signatures of the sign of strength and the last point of support are opposites.
- Sign of strength: Price has to close through the range high on 1.5 to 3 times average volume or more.
- Last point of support: When the pullback returns near the range high, volume has to be clearly dried up, and support has to hold.
If the sign of strength is under 1.5 times volume, or the last point of support prints on volume similar to the range average, the break is likely false.
SPY's volume signature from the selling climax at a low of $218.26 on March 23, 2020, through early April sat close to the schematic. The March 23 selling-climax candle was 1.2 times the prior 20-bar average (volume had already swollen in mid-March). The automatic rally through March 26 closed at $261.20 on volume about 79% of the selling climax. The April 1 secondary test made a low of $243.90, above the selling-climax low, and volume stayed at 58% of the selling climax. On April 6 the sign of strength closed at $264.86, through the March 26 high of $262.80, on volume 58% of the selling climax. Candle shapes were rough every day because of the volatility, but the signature order mostly matched the nine-event order. The secondary test stopped at a higher low without retesting the selling-climax low, and sign-of-strength volume was lower than selling-climax volume. Those two points differ from the schematic.
On the NVDA daily chart, find a range that has gone sideways for at least six weeks after a large prior decline.At the start of the range, preliminary support, selling climax, automatic rally, and secondary test appear in time order.Selling-climax volume is at least 3 times the prior 20-bar average.Automatic-rally volume and secondary-test volume have cooled to 50% and 30% or less of the selling climax, respectively.OBV holds a clear rise inside the range.The spring candle breaks 1–3% under the range low and returns inside the range on the same candle.The next test candle's volume has cooled to 50% or less of the spring.A sign of strength appears, closing through the range high on at least 2 times average volume.Enter long where the last-point-of-support candle returns near the range high and closes above it.Place the stop 1 ATR under the range-high line.If price breaks back through the range high on a close, exit.
Extending the schematic to daily and weekly charts
The schematic Evans originally drew was built on daily or weekly stock charts. On the NYSE of the 1940s and 1950s, one accumulation cycle usually ran 8 to 16 weeks, and the nine events spread out far enough to see. The same nine events keep the same mechanism when the timeframe changes.
Weekly bars bundle the shorter swings of the daily chart and make the larger range easier to see. Raising the timeframe does not create a skipped spring or a skipped backup. A shortened variant, such as BTC in 2022–2023, is marked on the weekly chart by separating the main events from the time they were confirmed. Do not force every bar into nine labels.
The daily chart splits one weekly bar into several bars. A normal stock week has five sessions. A crypto week, traded around the clock, has seven days. More bars do not mean noise has grown by the same multiple. When a secondary test or a spring stretches across several daily bars, read the group and the full price range together.
Schematics on the 4-hour chart and below are where algorithmic trading steps in, and the compressed characteristics from Part 5 show up often. A selling climax and a spring can compress into a sudden drop inside one candle, and the automatic rally and the secondary test often oscillate inside the same stretch of time and are hard to tell apart. A short-term schematic is safer only as a tool for refining the entry, after the range has been found on the weekly and daily charts.
ETH also ran the nine events on the daily chart. The selling climax printed on November 9, 2022, at a low of $1,074, on 3.3 times the prior average volume, and the automatic rally printed on November 10 at a high of $1,350. The secondary test on November 21 made a low of $1,080 on volume 37% of the selling climax, and from December into early January a long cause pattern ran with no spring. The sign of strength printed on January 14 at a close of $1,550, on 2.9 times the prior average volume, and the January 18 close of $1,511 was the last point of support. The same sequence is visible if that stretch is split into 4-hour bars, but noise inside Phase B makes it harder than on the daily chart to see which bar ends the secondary test.
Case study — mapping the BTC 2023 accumulation schematic
BTC's daily range from November 2022 to January 2023 is a variant: some events were skipped, and the selling-climax low was updated on the retest. Read it against a high of $18,388, a low of $15,476, a width of about 18.8%, and a span of about nine weeks (November 9 to January 12), and separate the time an event was seen from the time the idea was confirmed.
The longer preliminary support before this range had already printed at a low of $17,622 on June 18, 2022. The November accumulation range itself started with the November 8 drop on the FTX bankruptcy news (open $20,591, close $18,547). Panic selling hit from the next bar. The selling climax printed on November 9 at a low of $15,588. That day's volume was 2.4 times the prior 20-bar average, and the close was $15,923, $335 above the bar's low. The automatic rally rebounded to a high of $18,199 on November 10, and that day's volume was about 83% of the selling climax. The secondary test was confirmed on November 21 at a low of $15,476. It broke the selling-climax low by $112 (0.7%) and closed at $15,781, on volume only about 44% of the selling climax. Under this article's strict secondary-test rule, Phase A cannot be called complete on November 21, the day price broke the selling-climax low. This case watched that low as a new range floor, then confirmed the accumulation idea with later higher lows and the sign of strength. It did not declare completion at the secondary test.
Phase B oscillated between $16,256 and $18,388 for about five weeks, from early December to early January. The bars looked like ordinary range noise, but the OBV line held a clear rise, and volume bars near the range low kept closing smaller than those near the middle, a drying-up signal. Signs of schematic #2 were showing up little by little inside the range.
Phase C did not print a separate spring. Instead, a short downside test on December 30 made a low of $16,333, above the selling-climax and secondary-test lows, on 0.9 times the prior 20-bar average. Lows on January 1–3 kept rising to $16,499–$16,605, and price climbed toward the range high without testing the floor again. The path was close to schematic #2.
The sign of strength printed on January 12, 2023. Price closed through the range high of $18,388 at $18,847, on 2.8 times the prior 20-bar average. The next closes were $19,930 on January 13 and $20,955 on January 14. The last point of support formed on January 18 at a low of $20,407, and the pullback stopped above the $18,388 range high. There was no backup back into the range. An entry on the close of that sign-of-strength bar caught the trend that ran to a high of $31,804 on July 13 of that year.
This case is not a copy of the diagram. The spring and the backup into the range were absent, the secondary test updated the selling-climax low, and automatic-rally volume at 83% of the selling climax failed this article's half-or-less rule. Do not treat every event and volume threshold as matched. Read it as a variant confirmed later by higher lows, the sign of strength, and the last point of support.

Three traps in using the schematic
- Trap 1, waiting for the chart's outline to match the diagram: This is the common one, and the expensive one. Evans's diagram is a simplified picture for students. Live charts arrive with different volatility and a different time span every time. If you wait for an entry that matches the diagram's outline, you miss the real accumulation on that asset because the shape differs, and most places that do look like the diagram are noise. Rebuild the order around the nine-event sequence and the volume signatures.
- Trap 2, deciding it is not accumulation because there is no spring: Traders who do not know schematic #2 (accumulation without a spring) fall into this. Drop a range from the accumulation list only because it has no spring, and you can miss a clean accumulation such as the BTC 2022–2023 range. Once you have confirmed there is no spring, the next step is to check the schematic #2 pattern. Look at the volume-profile distribution and how often small shakes appear inside the range.
- Trap 3, using a short-term schematic (4-hour and below) as the first identification tool: On short timeframes, where algorithmic trading interferes, the nine events compress or scatter and the sequence itself gets shaky. The stable order is weekly to find the schematic, daily to check and refine it, and 4-hour to fine-tune the entry. Start on the short timeframe and noise will pull you into the wrong range.
Two ways to make schematic mapping more accurate
- Draw the phase map yourself: When a candidate range shows up, mark the nine events on it in time order. On paper, note whether preliminary support, selling climax, automatic rally, and secondary test all printed on the left side of the range, whether OBV rose through Phase B, whether a spring or a small shake shows on the right side, and whether the sign of strength and the last point of support printed near the range high with the volume signatures.
- Check alignment across three timeframes: Find the range on the weekly schematic, check the volume signatures of the nine events on the daily chart, then refine the entry timing of the last point of support and the backup on the 4-hour chart. If the three timeframes do not share the same sequence, the range is likely a pattern that only flashed on one timeframe, and the entry is clearly less reliable.
If 7 or more of the 9 phase-map items appear in order, the range is a real accumulation candidate. At 5 or fewer, it is more efficient to move to another range. A borderline count of exactly 6 depends on which items are missing. If a central event such as the selling climax, the spring, or the sign of strength is among the missing six, drop the candidate. If only a secondary event such as preliminary support or the backup is missing, check one timeframe higher and keep it as a candidate.
The automatic identification logic in the next article, the Wyckoff scanner, also uses this three-timeframe alignment as a core condition.
