OptiNod Academy
Wyckoff Method — Using a Wyckoff Scanner to Identify Accumulation Setups Automatically (Part 7)
A workflow that turns the volume and price features of the nine events into quantitative rules and automatically pulls accumulation candidates from the whole market.
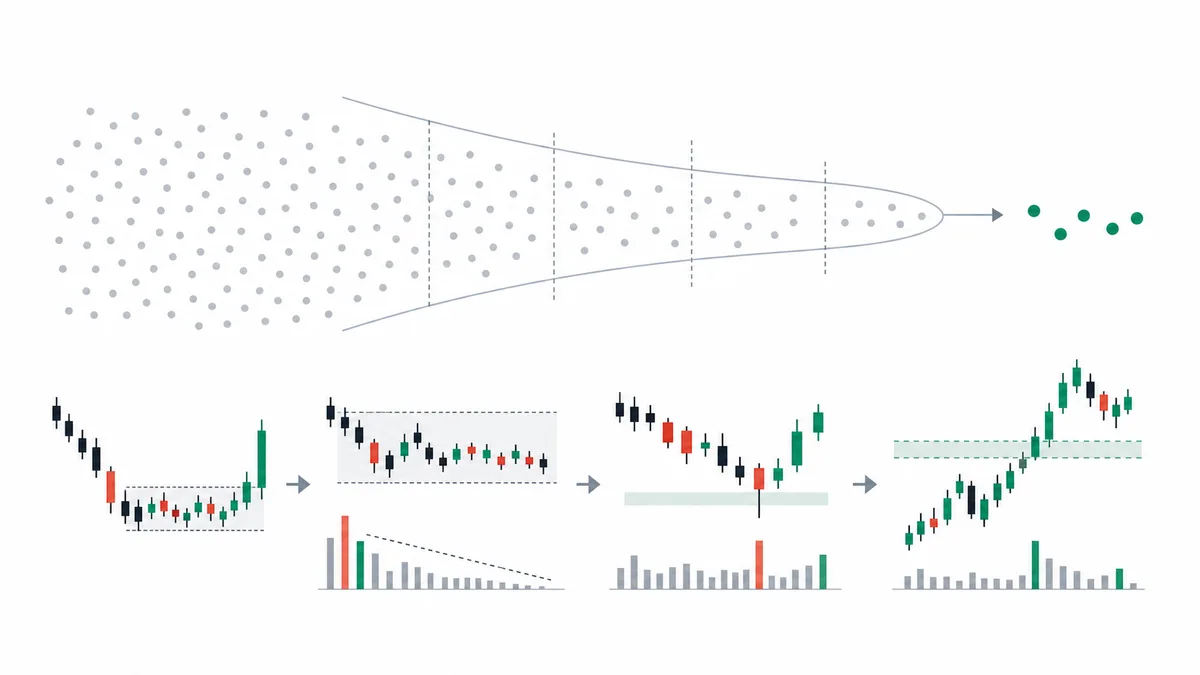
The features of the nine events can be written out as quantitative rules. You do not have to rely only on human intuition to narrow the candidates. Automation handles the work only through the step that pulls candidates. The last judgment is a person's.
Across the first six parts we covered the Composite Operator (the big-money players) concept at the heart of the Wyckoff method, the four-stage cycle of accumulation and distribution, the nine events, volume spread analysis and Weis Wave, the adaptations in crypto and algorithmic markets, and the schematic roadmap. This last part deals with one operating problem: how to pull stage B and stage C candidates, bar by bar, out of the whole market.
The biggest obstacle for traders learning Wyckoff is usually operational. The real constraint is that you cannot manually review 400 charts every day.
The common view can be reduced to one line: "Wyckoff cannot be automated because it requires a person to read the chart." That view is flawed because it treats judgment and candidate extraction as the same task.
The final judgment is clearly human work. But the work of finding candidates does not have to be done entirely by hand.
Each of the nine events has a clear volume and price feature. Those features can be written out as quantitative rules.
The features of Phase B are a long sideways stretch and declining volume, and the features of a Spring are a temporary break of the range low, a volume spike, and an immediate return. Both features can be checked by code on every bar.
The key idea in this final part is simple: judgment cannot be automated, but candidate extraction can.
The workflow compresses stage B and stage C candidates from 200 to 500 names across the market down to 5 to 10 a week, so a person can focus only on the last step of judgment. That is the purpose of the Wyckoff scanner.
The scanner's job is compression. This article ties together the tools covered throughout the series into a practical trading routine.

Writing the Stage B Features as Quantitative Rules
Stage B is the longest stretch of the accumulation cycle, the stage where large players gather inventory inside a sideways range of 4 to 12 weeks. There are three features.
- Range width and duration: How narrow the range is and how long it holds.
- Volume contraction: How much volume declines inside the range.
- Volatility, or ATR, compression: How much volatility narrows inside the range.
Because all three can be expressed as clear numbers, they can be written as quantitative rules. The thresholds below (box width 15% or less, volume 70% or less, ATR 60% or less, a spring weighted score of 80 or higher, and so on) are the working standards that, in operating experience, balanced candidate count and accuracy best on altcoin daily charts. They are values that have to be adjusted to the asset class and the timeframe.
A range is defined when the difference between the highest high and lowest low over the most recent 20 candles is no more than 15% of the range midpoint. For example, if SOL trades between $220 and $250 on the daily chart for at least 20 candles, the range width is about 13%, making it a range candidate.
The minimum duration of the box is 20 daily bars (about 4 weeks for stocks, about 3 weeks for cryptocurrency, which trades 24 hours). Anything shorter is likely a simple correction, so it is not treated as stage B.
On the weekly chart, a range width of 20% or less and a duration of at least 8 candles usually fits more naturally.
The volume-contraction feature is average daily volume inside the box at 70% or less of the 30-bar average just before the box. In the stage where the Composite Operator is taking inventory, buying and selling balance and volume itself shrinks into a dry market.
From June 18 to July 7, 2025, BTC stayed in a $98,200 to $110,529 box (box width 11.8%) for 20 bars, and average daily volume fell to 69% of the prior 30-bar average. On July 9 the close of $111,234 cleared the top of the box, and the next day, July 10, volume rose to 1.9 times the prior 20-bar average as it closed at $116,010. That volume pattern is the feature of the move from stage B into Phase D.
ATR compression is set as ATR(14) inside the box at 60% or less of the ATR just before the box. Natural volatility compression means buyers and sellers are concentrating their activity into a narrower price area. It is the quiet period before a trend forms.
ETH stayed in a $1,150 to $1,277 box from December 18, 2022 to January 6, 2023. Average ATR(14) inside the box shrank to 52% of the 60-day average before the box. On January 9 the close of $1,320 broke the top of the box, and volume rose to 2.3 times the prior 20-bar average. Within two weeks it rose to around $1,600 and entered a full trend phase.
Combine the three features in code and you get a function that checks every bar. Only names that pass every threshold for box width, duration, volume contraction, and ATR compression go on the stage B candidate list. The rest are dropped at the next check.
Scan the top 400 altcoins by market cap every day and apply the stage B, volume profile, and spring filters, and daily candidates remain. Names that pass on a given day can repeat through the week, so the weekly list removes duplicates by name and reviews them again. Do not read it as a simple sum of the daily candidate counts.
Spring Candidates Are Pulled Automatically by Combining Volume and Price Conditions
The next step for a name that has passed stage B is to pull the spring feature of Phase C. A spring is a price move that briefly breaks the bottom of the box and then comes straight back inside, and the feature is defined by combining four conditions.
- A clear break of the box low: This article's separate scanner filter passes cases where the break distance divided by the box's price width is 2-4%. That is a different number from the percentage drop versus the box-low price. Missing this band is not, by itself, a reason to reject every spring. Keep this filter's pass condition separate from the general pattern description in Part 2.
- A volume spike on the break candle: The threshold is at least 1.8 times the prior 20-candle average.
- Immediate return: The close must return inside the range within the next 1 to 3 candles.
- Sustained volume on the return candle: The return candle should maintain at least 70% of the break candle’s volume to confirm genuine buying intent.
Write these four conditions in code and you can score a spring candidate on every bar inside the box.
Take BTC in June 2023. BTC was in a box of about $25,400 to $26,800. On June 14 it broke the box low and went down to $24,820, but the close of $25,128 stayed just under the box and did not come straight back inside. That bar alone is hard to read as a spring.
The next day, June 15, BTC made another push down to $24,800, then returned into the range and closed at $25,598. Volume rose to 1.2 times the prior 20-candle average, but that falls short of the 1.8x threshold. Because the volume surge, one of the four conditions, is not met, the weighted score is 75 or below. It does not exceed the 80-point threshold, so the candle does not make the candidate list.
Even on the same kind of break, whether volume comes in and the close returns inside the box quickly is what separates a spring. This case had price structure close to a spring, but the volume condition was short and the score filtered it out. Right after that, BlackRock's spot ETF filing (June 15-16) became the catalyst, and BTC cleared $31,000 on June 23.
Automatic extraction scores 25 points for each of the four conditions that is met and 0 if it is not. The possible totals are only 0, 25, 50, 75, and 100. Under this method, the existing threshold of 80 or higher is 100 points, which is the case where all 4 of 4 conditions are met. Volume-profile adjustments are a separate review item and are not mixed with this base spring score.
Passing only one or two conditions does not qualify a candidate. Check that all four pass; how much this rule reduces false signals requires separate validation.

Remember that what the scanner pulls is a bar that has the spring feature, and confirming the spring itself is a separate judgment. Having the feature does not make every one a real spring. To judge a real spring, a person has to weigh the next three things together.
- How solid the box is: the duration of stage B.
- The state of the whole market: the major BTC trend.
- The strength of the prior sign-of-strength candidate.
The scanner prepares the evidence. It does not draw the conclusion.
Volume Profile Together with the Wyckoff Scanner
The tool that lifts the accuracy of candidates the Wyckoff scanner pulls by one more step is the volume profile. A volume profile shows the volume traded at each price over a set period as horizontal bars, and it shows which price area the volume crowded into.
Combined with the Wyckoff scanner, it becomes the core tool for sorting a box that is a real accumulation area from a box that disguises distribution as accumulation.
A box's volume profile splits two ways.
- Concentration at the bottom of the box (inverted triangle): Volume crowds near the bottom of the box and stacks in an inverted-triangle shape. This is the feature of a real accumulation area, where large players take inventory at the bottom of the box.
- Concentration at the top of the box (upright triangle): Volume crowds near the top of the box and stacks in an upright-triangle shape, the feature of large players distributing inventory at the top of the box.
Even when the box shape is the same, where the volume crowded on the volume profile decides stage B (accumulation) and stage B (distribution) in opposite directions.

Take LINK in April and May 2026. LINK moved sideways for 20 bars, from April 14 to May 3, in an $8.91 to $9.87 box (box width 10%), and on the volume profile 38% of the volume stacked in the lower third of the box ($8.91 to $9.23). That is the feature of accumulation at the bottom of the box. After that, on May 6, a close of $9.99 broke the top of the box on 2.1 times the prior 20-bar average volume, and four days later LINK rose to $10.87.
The opposite case is ETH in January 2026. From December 31, 2025 to January 19, 2026, ETH moved sideways for 20 bars in a box of about $2,959 to $3,403, and 41% of the volume crowded into the upper third of the box ($3,255 to $3,403). From January 13 to 18 the close stayed between $3,284 and $3,355, but it did not clear the $3,403 top. On January 20, when volume rose to 1.8 times the prior 20-bar average, the close of $2,940 broke the bottom of the box, and the next day ETH fell to $2,866.
Even when the range structure looks similar, where volume has built separates the two scenarios completely.
The way to add the volume-profile distribution to the scanner's quantitative rules is a simple threshold: volume share in the lower third of the box at or above 35%, or volume share in the upper third of the box at or above 35%.
- Lower-third volume share of 35% or more: Add 10 points to the accumulation scenario score.
- Upper-third volume share of 35% or more: Subtract 15 points as a distribution scenario penalty.
Adding just this one step automatically filters about 70% of fake springs (a break of the box low inside a distribution box).
The caution when combining a volume profile with the Wyckoff scanner is the time scale of the box. A 4-week sideways box on the daily chart has a large enough sample on a daily volume profile, but a 5-day sideways box on the 4-hour chart has only about 30 bars on a 4-hour volume profile.
When the sample is thin, the distribution itself is hard to trust, so the scanner's volume-profile check is stable only when the box has 50 bars or more.
Compressing the market into 5 to 10 candidates each week
The operating flow of the Wyckoff scanner is a funnel. It starts with the top 400 altcoins by market cap (or the top 100 global stocks), and daily automatic checks narrow the candidates at each step.
- Step 1: Range filter: Only symbols that pass all three conditions move to the next stage: range width of 15% or less, duration of at least 20 candles, and stable range midpoint. Of the top 400 by market cap, an average of 80 to 120 names pass this step. Names in strong trends or with high volatility are removed here.
- Step 2: Volume and ATR compression filter: Only symbols where average daily volume inside the range is 70% or less of the prior 30-candle average and ATR(14) inside the range is 60% or less of the prior ATR pass this step. Of the 80 to 120 names from Step 1, an average of 25 to 40 pass Step 2. Ranges where volume remains normal, or sideways moves that only look like valid ranges, are filtered out here.
- Step 3, volume-profile distribution filter: Only names whose volume share in the lower third of the box is 35% or more are classified as accumulation candidates. Names with a high share at the top of the box are classified as the distribution scenario and pulled out separately. Of the 25 to 40 that pass step 2, an average of 10 to 15 remain as accumulation candidates, and the rest are classified as distribution or neutral boxes.
- Step 4, spring-feature filter: Only names that have a bar, somewhere inside the box, with a spring weighted score of 80 or higher inside the last 5 bars are registered as candidates that can be entered. Of the 10 to 15 that pass step 3, an average of 3 to 7 pass step 4, and this list is the daily candidate list that goes to the person's final judgment. On the weekly list, duplicate names are removed and reviewed again.
Applying this funnel daily to the top 400 names by market cap compresses the weekly candidate list to an average of 5 to 10 names.
Instead of a person looking through 400 charts every day, the workflow becomes a precise read of 5 to 10 charts once a week. That is the operating core of the Wyckoff scanner. Code handles finding candidates, and a person handles the judgment.
Assume SOL ranges between $175 and $200, breaks down to $173, and the next candle returns to close at $184.The range width is $25 and the break distance $2, so the break is 8% of the range width. It fails this article’s 2–4% filter.Even if the other three conditions are all met, the base spring score is at most 75, so it is not an 80-or-higher candidate.$184 is the return candle’s close, not the break candle’s close. This example does not register a candidate or enter a long.
Places the Scanner Misses — The Last Step a Person Has to Fill
Even if the Wyckoff scanner pulls 5 to 10 candidates, not every one of them is a real accumulation spot. There are three places the scanner structurally misses, and these three are the last step that only a person's judgment can fill.
- The context of the whole market: The scanner checks only an individual name's box and spring feature, and it cannot separately see the trend phase of the market that name belongs to. When BTC is in a clear downtrend on the daily chart, spring candidates can be caught in 100 altcoins at the same time, but most of those candidates do not become a real trend change until BTC's decline is over. What state the whole market is in right now is the last filter that sorts real accumulation candidates from fake ones, and the scanner cannot apply this filter automatically.
- Fundamental positive and negative events: The scanner sees only the price and volume features, and it does not know why those features appeared. If a large scheduled event is on the calendar, such as the November 2024 U.S. election, a clean stage B feature can show up on the scanner even when the capital that built that accumulation was moving to that event. The scanner does not know the event exists, and right after the announcement price surges much faster than a usual spring, so the entry timing is pulled forward. A scanner that is not combined with a fundamental-event calendar gives a signal one beat late in these spots.
- The moment the Composite Operator's intent changes: The essence of Wyckoff is tracking the intent of large players, but the intent itself shows up in price and volume only afterward, so the scanner's quantitative rules are bound to give a signal one cycle late every time. The moment large players finish accumulation and move into markup appears where stage C ends and stage D begins, and the scanner's feature check catches that branch point one or two bars late. In the spot where that one or two bars decides whether the entry is real, a person's intuition and a read of the whole chart come in as the last step.
So the Wyckoff scanner has to be designed as a tool that lightens a person's load. Used as a tool that replaces the person, it does not do its job. A workflow in which the scanner compresses 400 names to 5 to 10, and a person reviews those 5 to 10 for market condition, events, and a change of intent, can be run with about one hour of precise analysis each week.
Without the scanner a person cannot look at 400 names every day, and without a person the scanner's 5 to 10 end as false signals every time.
Trap 1 — Using the Scanner Score Straight as an Entry Signal
A trade that enters immediately at the close of the bar just because the Wyckoff scanner's weighted score printed 100 is a misuse of the scanner. The score is only a value that marks candidate status. Of five names that produced a score, three or four should drop out at the person's final judgment for other reasons.
An automated trading system that removes the human step between score and entry misunderstands what should be automated.
Trap 2 — Defining the range threshold too narrowly
If the range-width threshold is tightened from 15% to 10%, the number of candidates drops sharply and the false-signal rate also declines. But the percentage of true accumulation setups missed also rises.
The threshold is a trade-off between candidate count and accuracy. From operating experience, a box width of 12-18% and a duration of 18-25 bars give the most stable results on altcoin daily charts. Fine-tuning the threshold on every bar makes the scanner's operation lose consistency.
Trap 3 — Carrying the Scanner's Volume Conditions Unchanged into a Market That Never Closes
As covered in Part 5 of this series, volume in the cryptocurrency market varies widely by session and by day of the week. In a market where weekend volume falls to 50-60% of weekday levels, the scanner's condition of 70% or less versus the prior 30-bar average triggers automatically every Saturday and Sunday.
To avoid this false trigger, the volume baseline should be matched by day of week, such as comparing Saturday volume to the average of the prior four Saturdays, or weekend candles should be excluded from the range check.
One line to close the series: automation is compression
The last conclusion reached by working through the Wyckoff method across seven parts is one sentence. Wyckoff's nine events began as a language of intuition for a person reading a chart, but in today's market, where those features can be written out as numbers, automating the compression becomes the core of the trading routine.
A workflow that compresses 400 market symbols into 5 to 10 candidates each week, then lets the trader apply the final judgment on market condition, events, and intent change, turns Wyckoff into an operational trading tool.
The series that starts from the three laws in Part 1 (cause and effect, effort and result, supply and demand) passes through accumulation in Part 2, distribution in Part 3, and volume bar-range analysis and Weis Wave in Part 4. Part 5 is crypto and algorithmic markets, Part 6 is the schematic, and Part 7 is running the scanner.
The Composite Operator concept works the same way, unchanged, from the 1930s NYSE to today's algorithmic trading market, but the tools that carry that concept into a trade evolve with the times. The scanner in this last part is the close that connects the whole series to live trading.
