OptiNod Academy
Wyckoff Method — Modernizing Volume Spread Analysis and Weis Wave (Part 4)
Bar-by-bar signatures from volume spread analysis, and Weis Wave's volume summed by direction, make a Wyckoff stage measurable one bar at a time.
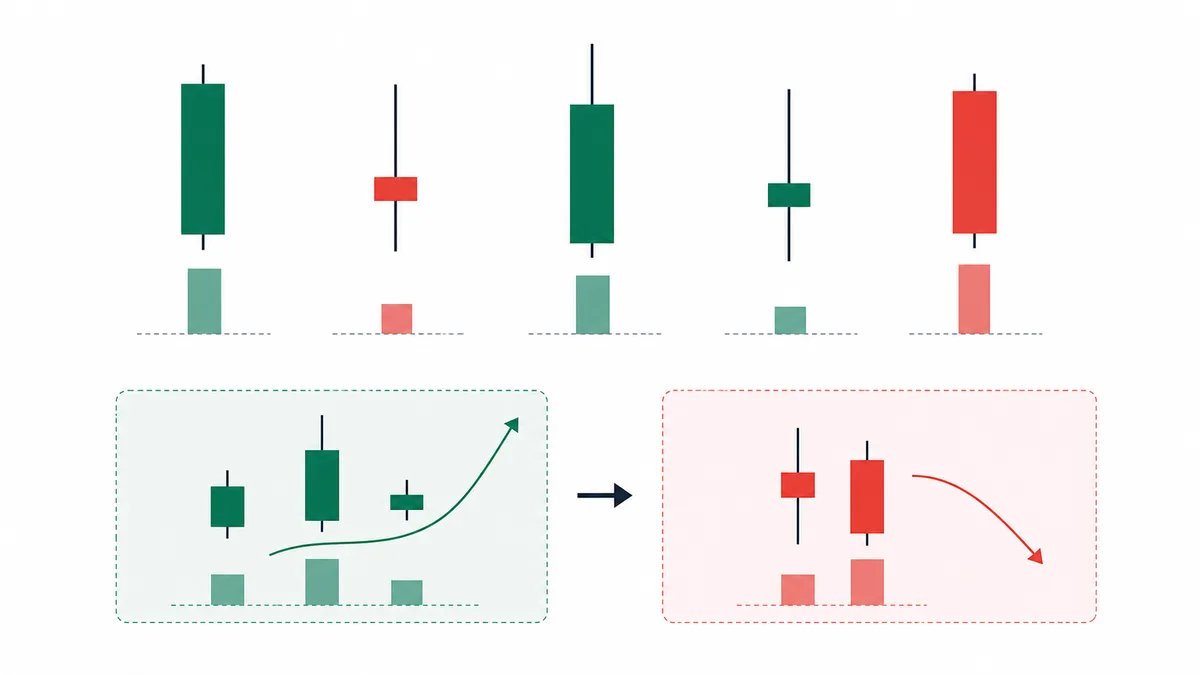
Williams's bar-level signatures and Weis's volume by direction make it possible to pin down the Wyckoff stage on each bar.
The first three parts covered the core of Wyckoff (the three laws), the five stages of accumulation, and the five stages of distribution. Parts 4 and 5 cover modern adaptations of Wyckoff. Part 4 covers two tools. One is volume bar-range analysis (volume spread analysis), which Tom Williams organized in his 1993 book The Undeclared Secrets That Drive the Stock Market. The other is Weis Wave, which David Weis developed in Trades About to Happen in 2013. Part 5 looks at how the same tools change in crypto and algorithmic markets.
The popular reading treats volume spread analysis as one more volume indicator, and files Weis Wave with cumulative volume lines in the same box as OBV. Classified that way, it is hard to see which Wyckoff limit each tool fills.
Williams turned Wyckoff's intuition — the idea that the relationship between volume and the price bar range shows what large players intend — into a bar-by-bar checklist. Named bar signatures such as No Demand, No Supply, Stopping Volume, and Climactic Volume let you judge, bar by bar, where the chart sits among the Wyckoff stages.
Weis, for his part, redesigned the unit used to sum volume. Ordinary volume bars follow the time axis, one bar of volume per price bar. Weis Wave groups bars that move in the same direction and combines them into one bar. You can then see on one line whether the effort behind a trend is holding or fading.

The Four Bar Signatures of Volume Spread Analysis — No Demand, No Supply, Stopping, and Climactic
Volume spread analysis starts by reading one bar in three ways: close location, bar range, and volume. Read together, they show the relationship between effort and result on each bar. The four core names Williams gave them are No Demand, No Supply, Stopping Volume, and Climactic Volume.
- No Demand: An up bar with a narrow bar range and volume clearly smaller than the bars just before it. Price rose, but the buying that produced the rise was thin. It is a place where the rise (the result) is excessive for the effort spent, and it often shows up late in distribution or at the end of a weak rebound.
- No Supply: A down bar with a narrow bar range and clearly small volume. Price fell, but there was no selling behind that drop. It often appears in Phase C and Phase D of accumulation, and it is a sign that selling has run out.
- Stopping Volume: During a large downtrend, a large down bar on huge volume, where selling pressure is absorbed inside the bar and the close recovers into the upper part of the bar. It is the place where large players take the whole flood of selling, and it often shows up just before or just after a selling climax or a Spring in accumulation. The core of this signature is that a large effort to the downside fails to drag price down, and the close comes back up. Price does not fall as far as the selling pressure that was spent.
- Climactic Volume: At the end of an uptrend, volume expands sharply, the bar range widens to 2x ATR or more, and the close falls to the bottom of the bar. It is the place where large players unload supply all at once, and at the bar level it marks the same event as a buying climax in distribution. For that reason, the high of a Climactic Volume bar often goes unrecovered for several months.
The new high NVDA made at $140.76 on June 20, 2024 came on daily volume only 1.2x the prior 20-bar average. The bar range, though, was 2.2x ATR, and the closing price ($130.78) sat in the lower 11% of the bar. The volume condition was weak, but the bar range and the close location had the shape of Climactic Volume, and the next day's volume rose to 1.4x the average as the decline continued. That high was not recovered until October 17, about four months later.
On August 5, 2024, the BTC daily bar was a large down bar on 5.8x the prior 20-day average volume. From a low of $49,000 it recovered to a close of $54,019, finishing above the middle, at the 54% point of the bar range measured from the low. That is close to Stopping Volume that absorbed heavy selling. Three weeks later, on August 25, price rose to $65,000.

Volume Spread Analysis Lets You Judge the Wyckoff Stage Bar by Bar
The five stages of accumulation and distribution covered in Parts 2 and 3 had a limit: they can be recognized only after they have passed. The bar-level signatures of volume spread analysis narrow that limit.
- Phase A: In a large downtrend, a Stopping Volume bar is picked up as a selling-climax candidate, and if a rally bar with shrinking volume (an automatic rally) follows within a few days, the start is confirmed at the bar level.
- Phase B: Inside a sideways stretch, repeated No Supply bars tilt it toward accumulation, and repeated No Demand bars tilt it toward distribution. The ratio of the two signatures sets the direction of the stage.
- Phase C: A spring bar starts as a high-volume down bar, then the close recovers into the upper 50% of the bar. Inside the same bar, selling pressure and price movement point in opposite directions. The mirror in the other direction, the upthrust after distribution, makes a new high on a large up bar and then closes in the lower part of the bar.
- Phase D and E: A sign of strength is a large up bar that breaks the top of the range, with volume expanding sharply and a bar range of 1.5x ATR or more. When both the bar range and volume are clearly large, read it as a break large players joined, and the odds of Phase E rise.
On August 5, 2024, SOL fell to a low of $110 and closed at $129.78, and that daily bar was Stopping Volume on 6.2x the prior 20-bar average volume. Read the August 9-22 daily bars in the $136-$164 range with volume spread analysis, and five No Supply bars appear (down bars, bar range under 0.8x ATR, volume under 0.8x average), confirming a Phase B signature. The August 23 up bar, though, had 0.7x volume and a bar range of 1.4x ATR, short of the sign-of-strength standard, and it did not lead to a break of the range high ($163.54), so the September 1 close was pushed down to $128.50. The bar that met the sign-of-strength standard came on November 6. An up bar that closed at $186.59, above the highest close of the prior 20 bars ($179.42), printed 3.2x volume, a bar range of 2.4x ATR, and a close in the top 86% of the bar, and within 16 days the high reached $264.

Weis Wave — Volume Summed by Direction
Ordinary volume bars are drawn in time, one bar per candle along the time axis. That shows the volume inside each bar accurately, but it does not directly show the total capital that came in while a trend was built. If a trend runs for seven bars, the volume is scattered across seven bars, and you have to add the sum in your head.
What David Weis reworked is that unit of summation. He combines the volume from the bar where a rise starts to the bar where it ends into one bar, and he does the same for the volume from the bar where a decline starts to the bar where it ends. The result is a volume chart that starts a new bar each time the trend direction changes, and the height of each bar shows the total volume that came in during that wave.
The line that splits waves is a reversal threshold. On the daily chart, traders usually use 2-3% or 1.5x ATR as the threshold, and a new wave starts when price moves against the prior wave's endpoint by that amount. The first step is therefore to set the threshold to the meaningful average pullback size of the asset you trade.
ETH's rise from a close of $2,398 on November 4, 2024 to a high of $4,108 on December 16 was drawn as a daily Weis Wave. It is close-based, and the reversal threshold is 5%. It splits into three rising waves, and cumulative traded value (volume times close) runs $15.1 billion, then $51.8 billion, then $10.2 billion. Weis Wave is originally a tool that sums volume (coins, contracts, or shares), but converting crypto into traded value makes comparison across assets easier.
The chart shows directly that traded value on the third wave fell to about 20% of the second wave. Price was still rising in the same trend, but effort was fading. The result was a correction from the December 16 high down to a low of $3,102 on December 20.
The Height of the Wave Bar Is the Real Size of the Effort
The trading value of Weis Wave is in how the height of the wave bars changes. Whether volume on same-direction waves inside one trend is growing or shrinking tells you whether the force holding up that trend is holding or fading.
- Declining waves: A pattern in which the rising waves inside an uptrend show less volume, one after another. It is a sign that the capital supporting each new high is shrinking. For that reason, the start of Phase B often shows up as shrinking waves.
- Expanding waves: A pattern in which the rising waves show more volume, one after another, and it is the healthy markup signature of Phase E. When the wave bars step higher, effort is keeping up with the trend.
- Corrective waves: Read them the same way. If corrective-wave volume is small and ends quickly, the trend is healthy. If corrective-wave volume starts to exceed the prior rising wave, that is the first sign of a trend change.
Split NVDA's daily markup from February to June 2024 with an 8% reversal threshold, and rising-wave volume grew in sequence: 4.9 billion shares, then 14.1 billion, then 17.4 billion. That flow is a textbook Phase E signature. Right after the same stock made a new high on June 18 (5% threshold), rising-wave volume shrank from 3.05 billion shares (June 24 to July 10) to 470 million shares (July 30-31), while corrective-wave volume grew from 1.64 billion shares (June 18-24) to 4.23 billion shares (July 10-30). That became the wave signature of an entry into Phase B.
Volume Spread Analysis and Weis Wave Together — Checking Stage B Accumulation and the Stage E Trend
Volume spread analysis shows precise signatures at the bar level, and Weis Wave shows the larger flow at the trend level. The two tools look at different time resolutions, so used together they filter each other's noise.
Stage B accumulation is confirmed when both conditions line up. When No Supply bars keep appearing inside a range, check whether down-wave volume in the Weis Wave of that same range is smaller than up-wave volume. If selling is thin at the bar level (volume spread analysis) and sell-side capital is also smaller than buy-side capital at the trend level (Weis Wave), and the two signals point the same way, confidence in the accumulation goes up a step.
A Stage E trend, once the bar that breaks the top of the range satisfies the sign-of-strength signature, asks whether the cumulative volume of the first rising wave over the next few days of Weis Wave is larger than any wave in the prior range. If both conditions hold, Stage E has actually started.
SOL is moving sideways for four weeks in a $130-$145 range on the daily chart,and over those four weeks, daily volume spread analysis shows No Supply bars repeating five times or more,and in the Weis Wave of that same range, average down-wave volume is 70% or less of average up-wave volume.The bar that breaks the top of the range ($145) on a closing basis has volume of at least 2x the prior 20-bar average,that same bar has a bar range of at least 1.5x daily ATR, and the close finishes in the upper 25% of the bar (a sign-of-strength match).Enter long at the close of that bar. Place the stop below the middle of the range ($137).If, within five bars of entry, the cumulative volume of the new rising wave is smaller than any wave in the prior range, treat the sign of strength as failed and exit.
The short setup in a distribution range is the same thing turned over. No Demand bars repeat inside the range, rising-wave volume on Weis Wave shrinks in sequence, and a close breaks the bottom of the range on a sign-of-weakness signature (a down bar at 1.5x ATR with volume sharply higher). That is the frame of the setup.
Entry is at the close of that bar, the stop goes above the middle of the range, and if the close comes back inside the range within five bars, the setup is invalid.
The shared frame of both setups is the same three layers. A bar-level signature (volume spread analysis), a trend-level check (Weis Wave), and a price-structure check (a close outside the range). An entry missing even one layer falls to the same level as an entry that used only one of the two tools.

Three Traps That Often Catch Traders Using Volume Spread Analysis and Weis Wave
- Judging a signature by absolute volume: Every signature in volume spread analysis is defined by volume relative to the bars just before it. Stopping Volume, for example, uses a relative bar such as "2x or more the prior 20-bar average." Lock it to an absolute number, and busy periods print false signatures constantly, while quiet periods hide the real ones.
- Freezing the wave reversal threshold regardless of the asset: Apply 3% to daily BTC and the waves split at a reasonable frequency, but apply the same 3% to daily SPY and one wave can run for months. Low-volatility assets such as SPY use 0.5-1%, and high-volatility assets such as DOGE and SHIB go as wide as 5-7%. First measure the average size of meaningful pullbacks over the past year of the asset you trade, and use that value as the threshold.
- Entering on a single volume-spread-analysis signature: Entering on one No Supply bar, or one Stopping Volume bar, misuses a signature as an entry signal. A volume-spread-analysis signature only points at the current state of the market. The real entry is valid when price structure changes at that spot (a sign-of-strength bar, a spring recovery, or a close outside the range).
Two Ways to Raise the Accuracy of Volume Spread Analysis and Weis Wave Signals
The wave direction on the higher timeframe. A volume-spread-analysis or Weis Wave signal on the 1-hour chart is clearly more reliable when it agrees with the 4-hour trend. If the 4-hour wave is in a declining trend and the 1-hour chart prints Stopping Volume only once, the move is likely to stay a short rebound, so reduce the entry size or postpone it.
How long the range lasts, and what the price area means. For repeated No Supply in Phase B to be a real accumulation signal, the range has to last at least three weeks. No Supply inside a one- or two-week range can just be noise from a brief absence of selling. If that range sits near a large historical support area, reliability goes up another step. Price structure tells you where accumulation could happen, and volume spread analysis confirms how buying and selling are building at that spot. Only when both conditions line up can you gauge the Phase B scenario bar by bar.