OptiNod Academy
Wyckoff Method — The 5 Phases of Distribution and UTAD (Part 3)
Distribution mirrors accumulation, but its timing and volume patterns are asymmetric. UT and UTAD sweep the last liquidity, while LPSY is the real entry point.
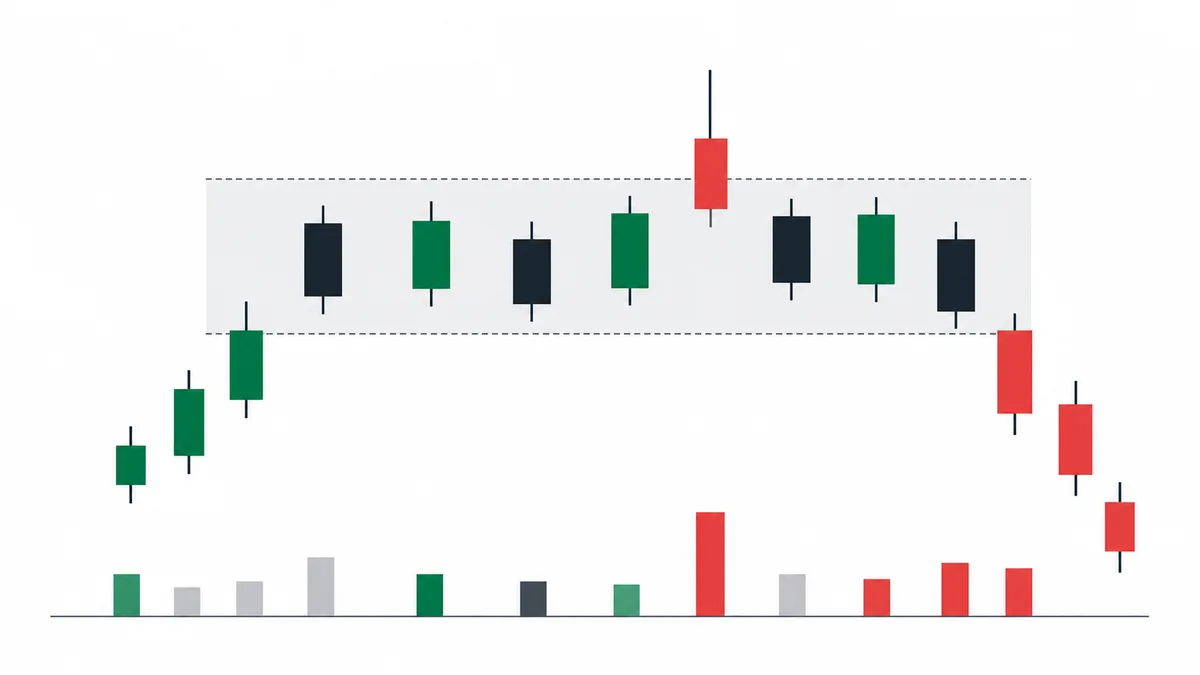
Distribution is the mirror image of accumulation. But it is not identical. Fear moves faster than greed, so timing and volume patterns are skewed.
In the previous article, we covered the five phases of accumulation. Distribution is its mirror image, but not a perfect copy. It follows the same five-phase structure, while showing different time compression and volume distribution.
In Phase A, the advance stalls and four events come in order: preliminary supply, the buying climax, the automatic reaction, and the secondary test. In Phase B, the Composite Operator keeps distributing inside the topping range. Then in Phase C, a UT or a UTAD absorbs the last liquidity. In Phase D, the last point of supply and the sign of weakness break the trend, and Phase E markdown follows.
The common interpretation treats distribution as a simple mirror of accumulation and compresses UTAD into a single “false breakout pattern.” That view misses two things.
- Timing: The time span of distribution is on average 30–50% shorter than accumulation. Fear-driven selling moves faster than greed-driven buying.
- The mechanics of the upthrust and the UTAD: An upthrust and a UTAD are where stops and stop-entry orders stacked above the range high get absorbed. They sit in the opposite place from a Spring and carry the opposite meaning, but the mechanism itself is the same.
There are two points where you need to adjust your lens.
- Accept the skew: Simply acknowledge that timing and volume are skewed to one side.
- Avoid early entries: Do not enter bearish setups too early in Phase B.
Phase B is when distribution is taking place, but price is still holding an upward structure. Countertrend shorts are repeatedly swept out. The real entry is the candle signature at LPSY. Everything before that is a waiting zone.

Phase A — Four Events That Stop the Advance (PSY, BC, AR, ST)
Phase A is where the uptrend stops. It mirrors Phase A in accumulation. Four events unfold in order.
- PSY (Preliminary Supply): This is the first event. During the uptrend, volume expands sharply for the first time and the candle closes near its midpoint. It signals that the Composite Operator is releasing meaningful supply for the first time. Price may keep rising for several days or even weeks, but the quality of the advance changes.
- BC (Buying Climax): This is the second event. A large bullish candle prints with the highest volume of the prior 50-100 candles. Retail participants rush in under the fear of missing out, and the Composite Operator sells into that demand, accelerating distribution. Check how far the BC close retreats from the high. A close near the bottom makes rejection of buying at the high clearer; a midpoint-to-high close is not required.
- AR (Automatic Reaction): This is the third event. It is the sharp drop right after buying at the BC is exhausted, and it also draws the first low of the topping range. A 5–15% drop from the BC high is typical, and the price the AR reaches becomes the low of the Phase B range.
- ST (Secondary Test): This is the fourth event. After the AR, price attempts to revisit the BC high. The key is that ST volume is clearly lower than BC volume. If price closes without clearing the BC high, the upper boundary of the range is confirmed.
Four events appeared in NVDA in November 2021. The November 18 up bar on 1.87x volume was PSY, and the November 22 candle with a $346 high corresponds to BC (1.64x volume, close at $320 near the candle low). The move down to a $309 low on November 23 (-10.9% from the BC high) was AR, and the ST with a $334 high on November 29 failed to reclaim $346 on about 60% of the BC volume. In December, the range continued within $272-$325.
Phase B — Distribution Is Underway, but Price Still Rises
Phase B is the longest and most deceptive stage in distribution. Price oscillates between the upper and lower boundaries of the topping range, while the Composite Operator quietly releases supply candle by candle near the range high. To the public, it looks like ordinary range-bound movement.
The main trap is entering bearish setups too early in Phase B. Many traders see the topping range and conclude, “It is distribution, so short the range high.” But the upper boundary in Phase B still has breakout potential. The range high is only truly confirmed after UTAD appears.
Phase B is also time-skewed. Accumulation Phase B takes an average of 8-12 weeks, while distribution Phase B usually ends in 4-8 weeks. The Composite Operator also knows that if distribution drags on too long, price may start falling on its own. So the distribution phase is compressed shorter than accumulation.
The key observation is the skew in volume distribution. In accumulation Phase B, watch whether volume at the range low declines over time. In distribution Phase B, the opposite happens: volume tends to shrink when price touches the range high and expand when price touches the range low. The exhaustion of demand and buildup of supply show up directly in volume.
SPY from December 2021 to January 2022 is a clear example. When price touched the range high (the $470 area) on December 8-10, daily volume averaged 70 million shares, and when it touched the range low (the $450 area) on December 1-3 and December 20, volume averaged 126 million shares, a gap of 1.8x. In late December price moved above the range high to $478, but volume was only 0.5-0.6x the prior 20-candle average, and after a high of $480 on January 4, price returned to $468 on January 5.


Phase C — UT and UTAD Sweep the Last Liquidity
Phase C is the decisive stage of distribution. The Composite Operator pushes price above the topping range one more time and takes the stops and chase-buy orders resting above the range high in one pass. It sits in the opposite place from an accumulation Spring and carries the opposite meaning, but the mechanism is the same.
A UT is a small false break above the range high that returns inside. A UTAD, the upthrust after distribution, is the larger false break that clears the range high, prints a new high, and then fails to hold and falls back into the range. UTAD is the stronger bearish signal because the wider the break, the more supply gets distributed.

UTAD has three signatures.
- Breakout-candle volume: The candle that closes above the range high does so on sharply expanded volume.
- Close location: That candle fails to close near its high.
- Fast return: Within the next 1-5 candles, price closes back below the range high.
A Test of UT often follows UTAD. After returning inside the range, price rallies back near the range high, but volume is lower than on the UTAD candle and price fails to reclaim the range high. This test is the confirmation signal for an LPSY entry.
After BTC’s October 20, 2021 high ($67,000), the topping range was set at $58,000-$67,000.On November 8, the daily candle closed above the range high at $67,000 (close of $67,526), made a new high of $69,000 on November 10, and closed at $64,882.Volume on the November 10 candle exceeded 1.5x the prior 20-candle average, and the close landed below the candle midpoint.If price closes back below $67,000 within the next three candles, treat the UTAD as confirmed.Enter short on the close of a Test of UT candle that fails to reclaim the range high in the $65,000s on declining volume (November 14, close of $65,519).Place the stop above the UTAD high at $69,000.If the test closes back above the range high at $67,000, abandon the UTAD read.
This is the standard Phase C entry. Risk is limited to the distance from the UTAD high to the stop, and if price falls to the range low, the reward-to-risk ratio is at least 2:1.


Phase D — Candle Signatures of LPSY and SOW
Phase D is where distribution ends and the market transitions into a bearish phase. The final high made by UTAD is no longer challenged, and price starts drifting toward the lower boundary of the topping range. Two events matter most.
- LPSY (Last Point of Supply): This is the first event. After UTAD or the Test of UT, price makes one final rally attempt inside the range, but the rally stalls between the midpoint and upper boundary of the range. Volume is lower than on previous rallies, and the candle closes below its midpoint. LPSY is the most stable short entry because distribution is nearly complete and there is no longer a strong basis to expect additional demand.
- SOW (Sign of Weakness): This is the second event. Right after LPSY, a large bearish candle breaks below the range low on a closing basis with sharply expanded volume. This candle is the start of the Phase E markdown. The more SOW volume exceeds the rally volume just before LPSY, the stronger the markdown.
LPSY is the real entry because of reward-to-risk. UTAD and the Test of UT offer short stop distances, but price may take a long time to reach the range low. LPSY is closer to the range low.
BTC in April-May 2021 is the example. After the April 14 BC at $64,854, a range formed, and no UTAD above the BC high appeared in this period. The rally from late April into early May stalled in the $56,000-$59,000 area (May 8 high of $59,500) and did not reach the BC high. Then on May 12, a bearish candle on 1.4x volume closed below $50,000 (close of $49,631), and on May 19 a large bearish candle on 4.2x the prior 20-day average volume fell to $30,000, and the Markdown continued.
Phase E — The Acceleration Structure of Markdown
Phase E begins after price breaks below the lower boundary of the topping range and begins an accelerated decline. It mirrors accumulation Markup, but it is shorter and more violent. It has three parts.
- Initial decline: During the first 5-10 candles after the range-low break, price falls through a sequence of large bearish candles. Volume expands sharply from candle to candle, and the former range low becomes new resistance. As long as pullback candles into the former range low close below that level, every pullback becomes another short entry.
- Mid-trend rallies: After the steep initial decline, price attempts several rallies, but each one forms a lower high below the previous high. These are pullbacks within the trend and often stall at the EMA(20) or EMA(50). A countertrend entry gets caught in a whipsaw and is stopped out every time.
- Capitulation: Near the lower part of the trend, a large bearish candle appears with the highest volume of the prior 100-200 candles. This is where the final retail stops are triggered. After this candle, price often shifts into a V-shaped rebound or sideways action, and that area may become the SC (Selling Climax) of the next accumulation Phase A.
TSLA from November 2021 to January 2022 shows the three-part sequence. After the $1,243 high on November 4, price fell to $893 on December 20, and the rally into late December and early January, to $1,208 on January 4, failed to clear the November high. The first decline started from the January 4 high. On January 10–13 a mid-trend rally reached $1,106–$1,116. The January 21 close was $944. On January 27, a candle with volume 1.76 times the prior 20-candle average closed at $829, and that was the capitulation.

The Timing and Volume Asymmetry Between Distribution and Accumulation
There are three key differences between distribution and accumulation.
- Speed of progression: A full accumulation cycle averages 3-6 months and can last more than a year. A full distribution cycle usually ends in 1.5-3 months. Once markdown acceleration begins, price can fall faster than the Composite Operator intended, so distribution has to be compressed and finished before that acceleration starts.
- Volume distribution: In accumulation Phase B, volume tends to shrink over time when price touches the range low. In distribution Phase B, the opposite happens: volume at the range high shrinks, while volume at the range low expands.
- Intensity of the Phase C event: An accumulation Spring is usually a small event that briefly breaks below the range low and quickly returns. A distribution UTAD is a larger event that clearly breaks above the range high and often prints a new high. In accumulation, supply can emerge naturally inside the range. In distribution, price often must be pulled above the range to absorb breakout buying and short stops at the same time.
If you do not accept this difference, it is easy for traders familiar with accumulation analysis to assume distribution will last too long. When Phase B enters its fourth week, they may keep waiting because they assume distribution is still underway. By the time they react, the LPSY entry is gone and Markdown has already started.
- Trap 1, shorting the Phase B range high too early: The range high is only confirmed after UTAD. If you short the range high before UTAD, you are likely to be swept out by the UTAD false breakout.
- Trap 2, mistaking UT for UTAD: UT is a small false breakout that briefly pushes above the range high and returns. It does not confirm that distribution is complete. Phase C only closes after UTAD appears.
- Trap 3, countertrend entries during markdown: Mid-trend rallies often stall at the EMA(20) or EMA(50), which can make them look like the end of the pullback. But volume shrinks during the rally, and the Composite Operator adds shorts right there.
Two Ways to Improve LPSY and UTAD Signal Quality
To improve the accuracy of distribution setups, read two things together.
Confirm with volume. A real UTAD requires two conditions: UTAD candle volume of at least 1.5x the prior 20-candle average, and a close below the candle midpoint. A range-high breakout without volume is more likely to be a genuine breakout. LPSY works the same way. The first requirement for confirming LPSY is that the rally candle inside the range shows clearly lower volume than the average of previous rallies.
Higher-timeframe context. A daily UTAD carries weight when it occurs near the high of the weekly trend. If the weekly chart is still in the middle of a clear uptrend and only the daily chart shows UTAD, it may be nothing more than temporary movement inside the weekly trend. But if the weekly chart is also inside a topping range, or if BC and AR are visible on the weekly chart itself, then a daily UTAD becomes a real signal.
In the next article, we go deeper into volume with volume spread analysis and the Weis Wave.
