OptiNod Academy
Candlestick Patterns — Heikin Ashi vs. Regular Candles (Part 8)
Heikin Ashi separates trend identification from entry signals. The tradeoff is delayed entry timing.
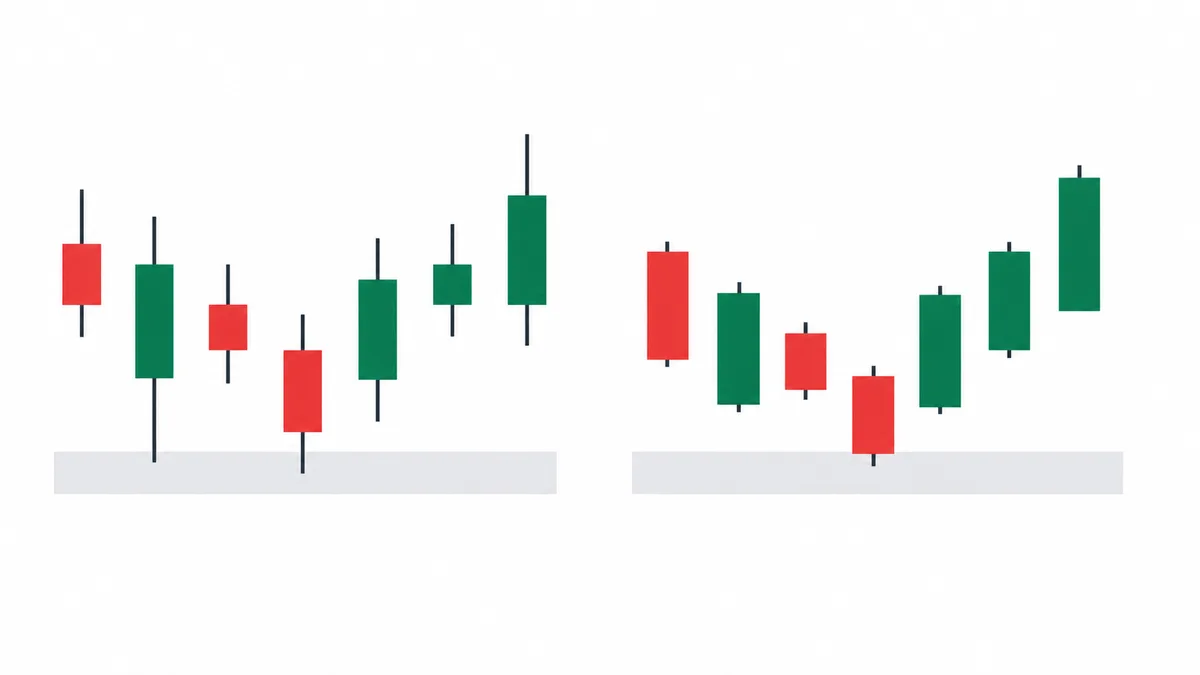
Heikin Ashi’s real value is that it lets you separate market state from the entry point. The cost is later entries.
This is the eighth article in the candlestick pattern series. The first seven covered the major standard candle patterns: hammer, doji, engulfing, inside bar, morning star, three soldiers, piercing pattern, and marubozu. This article is about the candle format itself. Heikin Ashi (平均足) comes from Japanese: heikin means “average,” and ashi refers to a bar or candle in Japanese candlestick charting. Literally, it means “average bar.” It is an averaged candle format developed to read price flow more cleanly, with roots in the Japanese rice exchanges of the 1700s, associated with rice traders such as Munehisa Homma. We are covering it separately because it changes the foundation used to read every pattern discussed in the previous seven articles.
The common explanation of Heikin Ashi has been reduced to one line: “candles that remove noise from regular candles and show the trend more clearly.” Because of that, many traders treat Heikin Ashi as automatically better than regular candles and never switch back once they add it to a chart.
That interpretation comes with two costs.
- Delayed entries: If you enter when the Heikin Ashi color changes, you will usually enter 1-2 candles later than you would with regular candles.
- Synthetic prices: If you forget that Heikin Ashi Open and Close values are averaged synthetic values, you may use the HA candle’s plotted Open or Close as support or resistance. Those prices may never have traded in the market.
This article shows how to use Heikin Ashi to identify the current market state, and regular candles to define entry signals and exact prices. If you place both candle formats on the same chart, use Heikin Ashi to read the market state and regular candles to execute entries. If you try to solve everything with one candle format, either Heikin Ashi’s delay or regular candles’ noise will keep getting in the way.

HA Calculation Formula — An Average That Carries Prior Information Forward
The Heikin Ashi formula comes down to two lines. The Heikin Ashi values are calculated like this.
- HA close = (open + high + low + close) ÷ 4
- HA open = (previous HA open + previous HA close) ÷ 2
- HA high = the maximum of the current high, the current low, the HA open, and the HA close
- HA low = the minimum of the current high, the current low, the HA open, and the HA close
The key part of the formula is HA Open. Because it starts from the previous candle’s average, every candle carries some information from the prior candle. This is why people say Heikin Ashi “reduces noise.” What is actually happening is that the current candle is being blended with the prior candle’s average, which smooths the chart. That is why an area where regular candles alternate between bullish and bearish can appear as a continuous bullish sequence on a Heikin Ashi chart.
When BTC moved sideways for five days around $90,000 in November 2024, regular candles were choppy, with two bullish candles and three bearish candles. Over the same section, every Heikin Ashi candle printed as a small bullish candle. Because HA Open starts from the previous candle’s average, when closes inside a range cluster around the average line, the gap between HA Open and HA Close repeatedly narrows toward the prior average.
So one point matters: prices on a Heikin Ashi chart are not actual traded prices. Even if HA Close appears at $91,000 on the chart, the actual market close was a different value. Heikin Ashi Opens and Closes are averaged synthetic values. If you use those levels for support, resistance, or stops, they can be misaligned with real traded prices. Draw price levels from the actual highs and lows of regular candles, where synthetic values are not mixed in.
The Cost of Noise Reduction Is Entry Delay
Heikin Ashi does show trends more cleanly than regular candles, but that clarity has a cost. The formula blends the current candle with the previous candle’s average, so signals are usually delayed by 1-2 candles.
Consider ETH in October 2024, when it rose from $2,400 to $2,750 and then rolled over near $2,700. On the regular candle chart, the October 21 candle broke lower as the first large bearish candle of the advance, making a potential trend reversal visible at that candle’s close. On the Heikin Ashi chart, the same October 21 candle still appeared as a small bullish candle. Because HA Open started from the average of the bullish October 20 candle, HA Close remained above HA Open even though the regular close had dropped. Heikin Ashi did not print its first bearish candle until October 22. By then, price had already fallen to $2,623, leaving the signal 1.6% late.
Heikin Ashi smoothing can absorb brief opposite moves into a same-color run. This does not mean ranges always stay one color. Continued back-and-forth movement can instead produce alternating short bullish and bearish runs. Do not confirm a trend or entry from color continuity alone; check the actual range on regular candles.
The fact that the same delay can either hurt or help depending on the market state is exactly why Heikin Ashi should not be used as the entry signal. In trends, it gets you in late. In ranges, it may look cleaner, but the entries still do not work well inside the range. Use Heikin Ashi to identify the current market state, and use regular candles for entry signals. That avoids both problems.
HA Color Changes — The Simplest Trend Identification Signal
Heikin Ashi is strong at identifying market state because the length of a continuous color sequence acts as a direct gauge of trend strength. On a regular candle chart, even five bullish candles in a row may include small bearish interruptions, making continuity harder to judge. Heikin Ashi’s formula carries forward the prior candle’s average, so clear trends produce clean sequences of the same color. Once a sequence exceeds five candles, the trend can be treated as established.
When NVDA rose from $480 to $630 in January 2024, the daily Heikin Ashi chart printed 17 consecutive bullish candles. The regular candle chart had six small bearish candles during the same stretch, but Heikin Ashi absorbed them and never changed color. That 17-candle run shows the direction of the current trend. Regular candle signals during that period should be read inside that flow: buy signals are more reliable, while sell signals are countertrend and require extra confirmation.
By contrast, when TSLA moved sideways between $230 and $265 for a month in December 2023, the daily Heikin Ashi chart kept breaking into short sequences: three bearish candles followed by four bullish candles, then three bearish candles followed by four bullish candles. No sequence exceeded four candles. That is a classic range. Even if the regular candle chart prints a bullish inside bar or hammer during that period, it is better to delay entry because the broader flow is not supporting a trend.
Use the length of continuous color to divide market state into three stages.
- 5 or more consecutive candles: Established trend
- 3-4 consecutive candles: Possible trend start
- Repeated breaks in short color runs: A range candidate. Even a same-color run does not confirm a trend if actual price remains in the range.
This classification acts as a context filter for candlestick pattern entries.
Use HA for Market State and Regular Candles for Entries
At this point, the way to combine the two formats becomes clear. Keep regular candles on the chart, and display Heikin Ashi for the same asset either in a separate panel or on another timeframe. Heikin Ashi tells you the current market state. Regular candles tell you the entry timing and exact price.
NVDA daily Heikin Ashi prints 7 consecutive bullish candles, confirming an established daily uptrend.On the 1-hour regular candle chart, a bullish engulfing pattern appears after a pullback.Enter long at the close of the second candle of the bullish engulfing pattern.Place the stop 1 ATR below the low of that second engulfing candle on the same regular candle chart.Exit when the daily Heikin Ashi chart changes color to its first bearish candle.If the daily Heikin Ashi chart turns bearish within 3 candles after entry, treat it as a shift in trend flow and exit immediately.
The key to this setup is that market state and entry are read on different timeframes. Market state is identified with Heikin Ashi on the higher timeframe, the daily chart. Entry is defined with regular candles on the lower timeframe, the 1-hour chart. Using regular candles for entry removes the 1-2 candle delay, while the higher-timeframe Heikin Ashi trend tells you in advance how to interpret the entry signal.
BTC 4-hour Heikin Ashi prints 6 consecutive bearish candles, confirming a short-term downtrend.On the 1-hour regular candle chart, a doji appears after a weak bounce.If the next candle is bearish and closes below the prior doji low, enter short at that candle’s close.Place the stop 0.5% above the high of the prior bounce.Exit when the 4-hour Heikin Ashi chart changes color to its first bullish candle, signaling a shift in flow.
Neither setup uses Heikin Ashi to determine the entry price. Heikin Ashi shows trend direction. Entry price and stop price both come from regular candles. This separation lets you use Heikin Ashi’s strength, market-state identification, alongside regular candles’ strength, precise pricing.
The Tail on a Heikin Ashi Candle — An Early Look at a Color Change
The tails on Heikin Ashi candles contain different information than the tails on regular candles. If a bullish Heikin Ashi candle has no lower tail, the actual low of that candle did not go below HA Open. HA Open is the midpoint of the prior candle's body, so bullish candles with no lower tail are common while price is rising.
This is a full marubozu-style Heikin Ashi candle, based on the same principle as the marubozu in Part 7 of this series. When SOL rose from $150 to $177 in October 2024, its daily Heikin Ashi chart printed 7 consecutive bullish candles, and 5 of them had no lower tail.
That shape alone did not say what price would do next. In daily data since 2016, SPY and QQQ were higher a week later about as often after a bullish candle with no lower tail as after one with a lower tail.[1] KOSPI, Nvidia, Bitcoin, and Ethereum rose slightly more often after candles with no lower tail, and Samsung Electronics showed almost no difference.[2]
When the lower tail on a bullish candle lengthened, the color often changed soon after. A long lower tail means price moved below HA Open during the candle and then came back up. When the lower tail grew much longer than those of the preceding candles in a bullish run, all seven markets we checked turned bearish within a few candles more often.[3]

A color change and a price decline were two different things. The share of cases where price was higher a week after a lower tail lengthened was lower for KOSPI, Nvidia, and Ethereum, and higher for SPY, Samsung Electronics, and Bitcoin.[4]
ETH in August 2025 is one such case. The daily Heikin Ashi chart printed 11 consecutive bullish candles before turning bearish on the 12th, and the lower tail on the 11th candle was about 7 times the average of the prior 8 candles. The color changed on the very next candle, but 10 days later ETH climbed past its earlier high in the $4,700 area to $4,956.
Upper tails on bearish candles behaved the same way. When they lengthened, all seven markets turned bullish within a few candles more often, but price was not higher a week later any more often.[5]
So read tail length only as a sign that the color may change soon, and set stops and position size from the actual prices on regular candles.
Three Traps When Using HA Alone
- Using Heikin Ashi candle prices as support and resistance: HA Open and HA Close are averaged synthetic values, so they are prices that may never have traded in the market. HA High and HA Low include the actual high and low, so they usually match real values. If you use synthetic opens and closes as the basis for support, resistance, or stops, your levels can diverge from actual traded prices. Draw price levels from the real highs and lows of regular candles.
- Entering on Heikin Ashi color changes alone: Smoothing can delay color changes or leave repeated breaks in short runs. Both can occur in a range, so the number of changes is not an entry rule. Confirm the higher-timeframe state against the actual price range and use regular candle signals for entry.
- Prioritizing Heikin Ashi when both signals conflict on the same timeframe: If regular candles print a clear bullish engulfing pattern but Heikin Ashi is still bearish, the Heikin Ashi bearish candle is likely still carrying forward the prior flow because of its delay. If you postpone entry there, you may repeatedly miss clean regular-candle entry prices. Use Heikin Ashi to read the higher-timeframe flow, and prioritize regular candle signals on the entry timeframe.
Two Ways to Improve HA Trend Identification
Two tools can make the larger Heikin Ashi flow more reliable.
First, use the ADX 20 threshold. Even if Heikin Ashi prints 5 or more consecutive bullish candles, if ADX stays below 20 during the same period, the move is likely a short directional push inside a range. Heikin Ashi continuity is a visual signal, while ADX 20 is a numerical measure of trend strength. Treat it as a trend only when both conditions are met. In September 2024, SPY printed 8 consecutive bullish candles on the daily Heikin Ashi chart, but ADX moved between 18 and 22. That rally ended as a temporary move to the top of the range.
Second, check whether higher-timeframe and lower-timeframe Heikin Ashi colors agree. If the daily Heikin Ashi candle is bullish and the 4-hour Heikin Ashi candle is also bullish, both timeframes are in the same state, and entry signals are most reliable. If the daily candle is bullish but the 4-hour candle is bearish, the smaller timeframe is in a short-term pullback, so a long entry becomes a pullback entry inside the larger trend. When the two timeframe colors differ, reduce entry size or wait until the lower-timeframe Heikin Ashi returns to the same color.
Heikin Ashi earns its value when used beside regular candles. Across this candlestick pattern series, one point becomes clear: what determines a pattern is the flow in which that pattern appears. The simplest tool for showing that flow is the continuous color sequence of Heikin Ashi candles. Every pattern from Parts 1-7 becomes more reliable when placed on top of the larger flow defined by Heikin Ashi.

- [1] The share of cases with a higher close five trading days later was 61.0% for bullish candles with no lower tail and 59.5% for those with one on SPY, and 59.8% and 60.4% on QQQ. Daily data since 2016.
- [2] The share of cases with a higher close five trading days later, without and with a lower tail: KOSPI 58.3% and 53.6%, Nvidia 61.2% and 55.2%, Bitcoin 53.0% and 49.9%, Ethereum 53.0% and 48.7%, Samsung Electronics 49.0% and 49.7%.
- [3] These are bullish candles whose prior 3 candles were all bullish and whose lower tail was at least twice the average of those 3 candles. The share that turned bearish within 3 candles: SPY 63.0% (47.6% for the other bullish candles with 3 bullish candles before them), QQQ 60.7% (48.2%), Nvidia 72.2% (52.0%), KOSPI 60.9% (47.0%), Samsung Electronics 71.5% (53.7%), Bitcoin 65.0% (49.4%), Ethereum 70.2% (50.7%). Daily data since 2016.
- [4] The share of cases with a higher close five trading days later, after a lower tail lengthened and for the other bullish candles: SPY 66.9% and 59.4%, QQQ 59.5% and 58.8%, Nvidia 53.8% and 57.2%, KOSPI 55.9% and 60.7%, Samsung Electronics 53.7% and 50.2%, Bitcoin 53.7% and 51.3%, Ethereum 49.0% and 54.2%.
- [5] These are bearish candles whose prior 3 candles were all bearish and whose upper tail was at least twice the average of those 3 candles. The share that turned bullish within 3 candles: SPY 77.1% (64.6% for the other bearish candles), QQQ 76.6% (65.5%), Nvidia 77.8% (67.1%), KOSPI 77.9% (65.7%), Samsung Electronics 73.3% (65.9%), Bitcoin 75.3% (60.3%), Ethereum 74.6% (58.8%). The share with a higher close five trading days later was equal to or lower than the other bearish candles in every market.