OptiNod Academy
Candlestick Patterns — What Marubozu and Large Candles Really Mean (Part 7)
The meaning of a large candle depends on its size relative to recent volatility and where it appears on the chart.
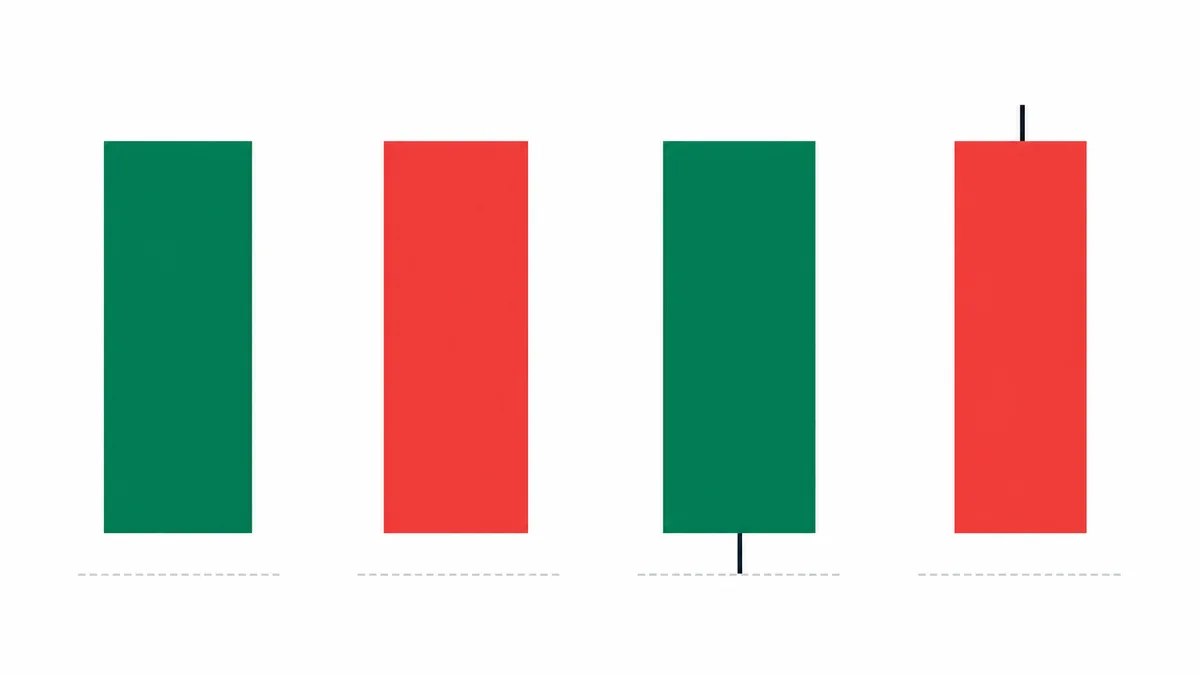
A large candle gives its signal in two ways: how large it is relative to recent volatility, and where it appears.
This is the seventh article in the candlestick pattern series. Parts 1-6 covered hammers and doji, engulfing patterns, inside bars, morning and evening stars, three white soldiers and three black crows, and piercing lines, dark cloud cover, and tweezers. Part 7 focuses on single large candles: Marubozu and its variations. The next article, Part 8, will cover Heikin Ashi.
Marubozu is one of the single-candle patterns in Japanese candlestick analysis, cataloged by Steve Nison in his 1991 book Japanese Candlestick Charting Techniques. In Japanese, the word means "shaved" or "bald." As the name suggests, it refers to a candle with no upper or lower wick, where the open and close sit at the two extremes of the candle. In a bullish candle, the open is the low and the close is the high. In a bearish candle, the opposite is true. It is evidence that price moved in one direction from open to close.
The popular interpretation is simplistic: "When a large candle appears, a strong trend starts in that direction." Follow that interpretation literally and you will repeatedly chase large candles, only to get caught in the next candle's pullback. After SOL printed a +12% daily bullish candle near $200 in March 2024, traders who chased the move were hit with an 8% drop within two days. The same +12% bullish candle can be the first candle of a move from $200 to $280 in one context, and the final blow-off at the top in another.
This article challenges that reading in three ways.
- Ratio to recent average volatility: The information in a large candle comes from its size relative to recent average volatility. Absolute size is not enough.
- Location: A large candle of the same size can mean the opposite thing depending on whether it appears inside a range or at the end of a trend.
- Internal candle flow: Closing Marubozu and Opening Marubozu reflect different price paths inside the candle, and the two variations do not carry the same reliability.

The Real Definition of a Large Candle: The 3x ATR Rule
If you judge a "large candle" by eye, a different candle will look large every time. A more rational standard is a body that is at least three times the average range of the previous 14 candles, measured by ATR. The measurement should use the body only, the distance from open to close, and exclude the wicks from the full range. A true Marubozu has no wicks, so the body equals the range by definition. In practice, Near-Marubozu candles can be analyzed in the same group.
3x ATR is only a line for sorting "this is large." How often such candles appear differs by asset and timeframe, so count it yourself on your chart's body/ATR sample.
BTC’s daily candle on October 23, 2023 rose 10.3%, from an open of $29,992 to a close of $33,070, printing a large bullish candle with a $3,078 body. The prior 14-day average ATR was $848, so the body was 3.6x ATR. Volume was also 3.0 times the prior 20-candle average. This candle exceeds the threshold and qualifies as a large candle.
Volatility differs by asset and by period. When BTC's ATR was $848 in October 2023, the +$3,078 candle was 3.6x ATR and cleared the threshold. By contrast, on November 6, 2024, when ATR was $2,330, a +$6,200 candle was twice the absolute size but only 2.7x ATR, just below the threshold. Even though its absolute size was smaller, the earlier candle was the stronger signal. If you do not divide by the previous 14-candle ATR, you will miss meaningful large candles in quiet markets and chase ordinary candles in noisy ones.
Inside a Range and at the End of a Trend Mean Opposite Things
Even when a candle is 3x ATR, its meaning changes completely depending on where it appears. A large candle inside a range is a breakout entry signal. A large candle at the end of a trend is an exhaustion signal, meaning buyers or sellers have spent their remaining force. In Wyckoff analysis, these are called BC, or Buying Climax, and SC, or Selling Climax.
When a large bullish candle closes above the top of a range, the candle itself shows accumulated demand breaking out all at once. In a range, supply and demand around both sides of the market stay balanced until one side fails and buyers absorb the overhead offers in a single move. On May 20, 2024, driven by ETF approval expectations, ETH printed a large bullish candle with a $591 body, from an open of $3,071 to a close of $3,662. That was 5.0x the prior ATR of $119, and volume was 2.8 times the average. Within the next 60 days, ETH rose to $3,977.
The same large bullish candle has the opposite meaning if it appears at the end of a six-month uptrend. It can mark a climax where the last remaining buy orders are filled in one candle as demand is fully depleted. Wyckoff calls this BC, or Buying Climax, and volume usually expands to at least 2-3 times the prior average. On February 28, 2024, BTC printed a large bullish candle from an open of $57,037 to a close of $62,432 (3.2x ATR). The prior 20 candles had risen 29%, volume was 2.9 times the average, and RSI was between 81 and 87. However, the next day's close of $61,131 was above the midpoint of the large candle's body ($59,735), and BTC went on to rise to $73,777 by March 14. ETH's large bullish candle on November 9, 2023 (4.1x ATR, 3.4x volume, RSI 84, +21% over the prior 20 candles) closed at $2,121, and five trading days later the close was $1,979, 6.7% lower. Both candles were exhaustion candidates but the outcomes diverged, so a climax should be judged together with confirmation from the next candle.
To distinguish a range candle from an end-of-trend candle, first inspect price position over the prior N candles. A narrow range over the prior 20 candles suggests a breakout candidate; a move of more than 30% in one direction over the prior 20 candles suggests an exhaustion candidate. ADX at 25 or above shows trend strength, so that alone does not prove the trend has ended. Use whether the next candle holds above the large candle's close, or is pushed back below the midpoint of the body, to confirm continuation versus rejection.

Closing Marubozu vs. Opening Marubozu: Different Flows Inside the Candle
A pure Marubozu has no wicks on either side. In live markets, that exact shape is rare. Modified Marubozu candles with a small wick on only one side appear more often. For bullish candles, there are two main variations.
A Closing Marubozu is a candle whose close sticks to the high, with a small wick only on the open side. OHLC alone cannot tell how much it shook in the middle of the bar. Read it as the close remaining at the high through the close, and confirm whether the next bar's close holds above that high. In 24-hour crypto, a gap-up is not required; check that the next candle's close finishes above the large candle's close.
An Opening Marubozu opens at the low and has a small wick at the high end. A close below the high shows some rejection of buying at the high. OHLC alone cannot reveal whether price paused and rose again intrabar or exactly when selling arrived. Confirm any pullback on the next candle separately.
The two variants are compared by how the next candle confirms them. If the next candle after a Closing Marubozu closes above the prior candle's close, that confirms buying pressure continued. If the next candle after an Opening Marubozu closes back inside the prior candle's body, be on guard for a short-term pullback. Do not decide the outcome from the candle shape alone; confirm the next candle's close.
Bearish candles follow the same principle with only the direction reversed. A Closing Marubozu whose close sticks to the extreme is a clearer candidate when it is used with next-candle confirmation. An Opening Marubozu is weaker as an entry signal because the close finishes pulled back from the extreme.

Only Large Candles Backed by Volume Are Real Signals
Even a 3x ATR candle is hard to treat as a real signal if volume stays near normal. The meaning of a large candle comes from how much new capital entered during that candle. If volume is only average, the candle may simply reflect a thin order book where price jumped without broad participation. A large candle backed by a major volume increase shows that market participants actually acted.
The standard is at least 1.5 times the average volume of the previous 20 candles. Above 2x is a strong signal. Above 3x is closer to a climax signal. ETH's +$396 bullish candle on May 8, 2025 was 5.9x ATR with volume 3.2 times the prior average. With both conditions met, it led into a +21.5% move over the next 20 trading days.
By contrast, a large candle on below-average volume should not be counted as a setup. If one or two large orders push price higher in a thin book, the chart will show a large candle, but it is hard to argue that broad market participation drove the move. In July 2024, around 3 a.m. Korea time, BTC printed a +$1,500 large candle on the 5-minute chart while volume stayed near the prior average. Within 30 minutes, price returned to its starting point. That is a classic whipsaw.
The First Candle After a Large Candle Decides the Next Action
Whether a large candle is an entry signal or an exit signal is determined by what the first candle after it does. If the next candle finishes above the close of a large bullish candle, it signals continuation. After a range breakout, that means the trend is starting in earnest. In the middle of a trend, it points to acceleration. But if the next candle falls below the midpoint of the large bullish candle's body, it signals rejection, and it is strong evidence that the large candle was a climax.
This next-candle confirmation is the simplest way to reduce the risk of chasing. Entering immediately after a large candle closes is a bet on the direction of the next candle, and statistically that is close to 50:50. Entering after the next candle closes above the large bullish close at least filters out spots that get pushed back immediately. The rate that follows differs by asset and period, so count it on your own sample.
After ETH's large bullish candle on May 20, 2024, from $3,071 to $3,662, the next day opened at $3,662 and closed at $3,790, above the prior close. That was a continuation signal, with +2.4% after 5 trading days and +1.2% after 20 trading days. The opposite case, a rejection (the next candle closing below the midpoint of the large candle's body), did not occur even once among the 14 bullish candles of 2.5x ATR or more on BTC and ETH daily charts since April 2023.
Next-candle confirmation is what separates pullback buying from chasing. If the next candle closes as a weak bearish candle or a doji, price often pulls back to the midpoint of the large candle's body within one or two candles. That pullback becomes the entry area for a continuation setup, and it also reduces the stop distance compared with a chase entry.
AAPL prints a +$6 large bullish daily candle, more than 3x ATR, while the prior 14-candle ATR is around $2. The wick is 5% or less of the candle's total length, and volume is at least 1.5 times the prior 20-candle average. Wait for the next daily candle to close above the large candle's close. Enter long at that candle's close, with a stop 1% below the large candle's open. If price breaks below the large candle's open within five candles after entry, treat the setup as failed and exit. The first target is two times the large candle's body length above the high, or high + $12.
ETH spends more than six weeks moving sideways in a $3,000-$3,200 range, then prints a large bullish candle of at least +3x ATR that closes above the range top at $3,200. Volume is at least two times the prior 20-candle average, and the candle shape is a Closing Marubozu, with an upper wick of 5% or less. If the next candle closes above the large candle's close, enter at that confirmation candle's close. Place the stop below the range midpoint at $3,100. If price returns to the midpoint of the large candle's body within the next five candles, exit because the risk of re-entering the range has increased.

Three Locations That Turn Marubozu Into a Trap
- Large candles right after news or events: Large candles after earnings, rate decisions, or regulatory news are immediate reactions to one-off events. Price often returns to its starting point after one or two candles once the event is absorbed, so treat it as a setup only after observing at least three candles of follow-through. A representative case is AMD's +4x ATR bullish candle after earnings on July 30, 2024, which was reversed the next day by a -2x ATR bearish candle.
- Large bullish or bearish candles at the start of a month or quarter: Capital flows can cluster at the beginning of a month or quarter, producing large candles unrelated to fundamentals. Volume may be 1.5-2 times normal, but the move often fails to continue and the next candle returns to normal behavior. For that reason, large candles at the start of a month or quarter require five additional candles of confirmation.
- Large candles on 5-minute and 15-minute charts: A large daily candle and a large 5-minute candle do not carry the same reliability. The shorter the timeframe, the thinner the order book tends to be, making large candles easier to produce even without a major volume increase. Whipsaws that look like breakouts are common. A 5-minute Marubozu matters only when it aligns with a large candle on the daily or 4-hour chart.
Two Ways to Improve Marubozu Signal Accuracy
The first is alignment with support and resistance. A large candle that breaks above the top of a range, a large candle that clears the prior high, or a large candle that closes above the 50-day moving average is a stronger setup because it clearly closes beyond an established price line. A large candle that absorbs all the supply at that level in one candle means the resting offers there have been cleared, making follow-through easier.
The second is alignment with momentum indicators such as RSI and MACD. If a large bullish candle appears as RSI breaks above 50, or as the MACD histogram flips from negative to positive, it confirms that stored momentum is being released through the large candle. On May 20, 2024, when ETH printed its 5.0x ATR bullish candle, RSI jumped 20 points in one candle, from 50 to 70, and the MACD histogram grew from +23 to +61. When these signals align on the same candle, the signal is much stronger than a large candle alone.
The most common trap is chasing a large candle without momentum confirmation. If a large bullish candle appears with RSI above 80, it is more likely to be the final push in an overbought zone. The same 3x ATR bullish candle means very different things when RSI moves from 45 to 62 versus from 78 to 88. One can be a trend-starting candle. The other can be a trend-ending candle. That difference determines the outcome after entry.
