OptiNod Academy
VIDYA — Adaptive Momentum-Weighted Average
A moving average that adapts automatically to volatility, producing fewer false signals in ranges than an EMA.
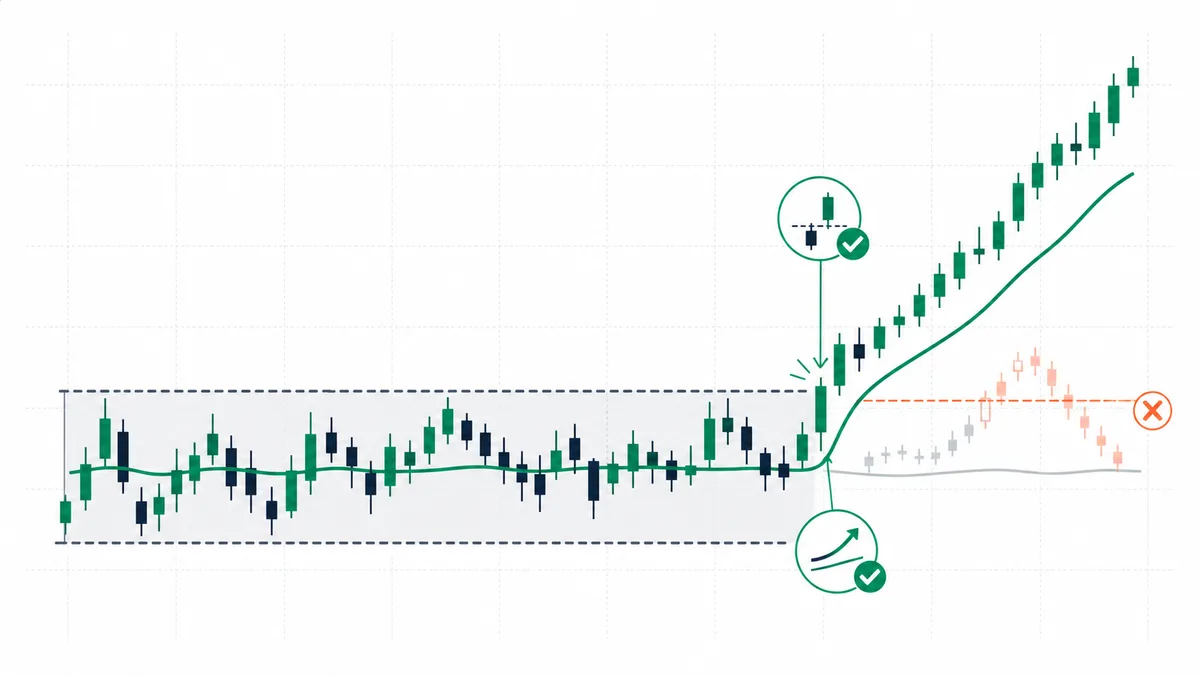
VIDYA is a moving average that changes its response speed based on the current market environment. When the trend is strong, it tracks price quickly. In a range, the average line nearly stalls, reducing false crosses.
An EMA follows price at the same speed whether the market is ranging or trending, so sideways markets create crosses on every small fluctuation. VIDYA, by contrast, lowers its smoothing coefficient when momentum weakens. The average flattens, and fewer signals are generated in the first place.
The key reference is the slope of the average line. If VIDYA is flat, keep entry tools turned off. Treat a bar as a trend-reversal candidate only when price breaks out of the range and VIDYA begins to slope.

CMO — An Efficiency Ratio for Trend Strength
VIDYA adapts not only to the size of the swings but also to how steadily that movement holds one direction. The absolute value of the CMO (Chande Momentum Oscillator) that Chande designed with it is what adjusts alpha.
CMO takes the sum of the upward moves over N bars, subtracts the sum of the downward moves, and divides that by the sum of the two totals. In plain terms, it is an efficiency ratio. Even at the same volatility, it separates a steady move in one direction, a trend, from a move that alternates up and down, a range. One detail matters: the scale. As a standard indicator, CMO is shown from −100 to +100, but the value VIDYA uses to adjust alpha is the absolute value after dividing by 100, normalized to −1 to +1. Every time this article writes absolute CMO between 0 and 1, that is this normalized scale, the standard reading divided by 100. A normalized absolute CMO near 1, near 100 on the standard scale, is a firm one-direction trend. A value near 0 is a range oscillating in roughly equal parts up and down.
KAMA is similar: a moving average that changes its speed by how steadily price has kept moving in one direction. Keep it separate from adaptation that looks only at the size of the swings, such as standard deviation or ATR.
When ETH stayed in a $1,530-$1,700 range throughout September 2023, normalized absolute CMO was mostly below 0.3, or below 30 on the standard indicator scale. Over the same period, EMA(14) produced five false golden/death crosses, while VIDYA(14) stayed almost flat and never generated a single clear signal. In a range, VIDYA’s value is that it stays out of the way.

The Line’s Slope Is the Entry Gate
Traders using EMA usually need to check separate conditions before taking an entry signal, such as whether ADX is above 20 or whether price is still inside the prior swing. With VIDYA, the average line itself performs that role. If it is flat, all entry signals are off. If it clearly slopes, evaluate entry candidates in that direction.
This simplification reduces the number of decisions. While VIDYA is flat, the system stays off. Reviewing every buy and sell setup inside a range tends to repeat five to ten false entries. Since trend-following systems usually suffer their largest statistical losses in ranges, this single gate can materially change system expectancy.

The Wake-Up Zone — From Flat to Sloping
The strongest VIDYA entry occurs on the bar where the average begins turning from flat to sloping. As a range ends and a trend begins, normalized absolute CMO rises from 0.3 or lower to 0.5 or higher, or from 30 or lower to 50 or higher on the standard indicator scale, increasing alpha.
After the ETH daily chart trades sideways for a month in a $2,500–$2,700 box,VIDYA(14) starts sloping up from flat (the slope grows by at least one standard deviation above the average of the prior five bars).At the same time, price breaks the top of the box ($2,700) on a closing basis.Buy at that bar's close. Place the stop below the middle of the box ($2,600). Even before the stop, if VIDYA goes flat again, exit.A close below the bottom of the box ($2,500) is the confirmation, from under the stop, that the box itself has already broken.
The key is that VIDYA starting to slope and price breaking out of the range should happen on the same bar. When both signals appear together, the probability of a false breakout clearly falls. If price alone leaves the range while VIDYA remains flat, it is likely not a genuine trend reversal.
The same setup can be inverted for short entries on a breakdown below the range low.

An Average That Adapts to Both Ranges and Trends
VIDYA’s behavior can be summarized in one line: in ranges it acts like an SMA, and in trends it acts like an EMA. When CMO is low, alpha shrinks, so the average moves slowly and produces smoothing closer to an SMA. When CMO is high, alpha rises toward EMA-like levels and follows price quickly.
Because of this automatic switch, one feature shows up on a pullback inside the trend. In strong trends, VIDYA can hug price even more closely than an EMA. As alpha increases, it catches up even to shallow pullbacks. That makes it easier to identify pullback-buying opportunities on smaller swings, but it also narrows the stop distance.
The solution is simple. For pullback entries inside a trend, place the stop 0.5 to 1 ATR below VIDYA. If the stop is attached directly to the average line, normal volatility will stop you out repeatedly. Adding ATR-based distance absorbs normal volatility and exits only when the trend actually breaks.
CMO Period as a Second Degree of Freedom
Standard VIDYA is often described as having one parameter, period, but most implementations accept two inputs: the VIDYA period itself and the CMO period. Traders often set both to 14 or both to 9, but separating them allows finer tuning.
A shorter CMO period, such as 5, makes the average react quickly even to short-term changes in volatility. The average can wake up easily on small trend attempts inside a range. A longer CMO period, such as 21, reacts only to larger flow shifts and ignores short-term volatility inside the range.
By separating the two periods according to the asset’s behavior, you can choose which lookback’s efficiency-ratio changes the average should respond to. For BTC daily charts, VIDYA(14, CMO=14) is usually enough. For altcoins with long, deep ranges, VIDYA(14, CMO=21) filters out false starts better.
Two Types of VIDYA — Check Your Implementation
Chande’s original 1992 version used a standard-deviation ratio as the adaptive gate. In 1994, in The New Technical Trader, he redefined VIDYA around CMO. As a result, two algorithms share the same VIDYA name.
Most TradingView community versions are CMO-based, but some older libraries use the standard-deviation-ratio version. The same data and parameters can therefore produce different results across two platforms. If you do not check which definition your tool uses, it can be difficult to reproduce backtest results.
Where VIDYA Can Still Fail
- Delayed reaction just after a trend begins: Because VIDYA keeps alpha low inside a range, it lags EMA by a beat on the first breakout bar. This is the cost paid for fewer false signals in ranges. A rule that enters at the close of the breakout bar naturally absorbs this delay.
- Entries without volume confirmation: When VIDYA turns from flat to sloped and volume clearly rises above its prior average, a real trend start becomes more likely. If volume stays near normal, the turn may be false.
- Higher-timeframe (HTF) conflict: If 1-hour VIDYA wakes up while daily VIDYA is still flat, the move is likely to stay short-term volatility. Reliability rises clearly only when the higher-timeframe VIDYA slope comes along with it.
