OptiNod Academy
JMA — Low-Lag Adaptive Average
The smoothest trend line: powerful while a trend is underway, but less reliable at turning points.
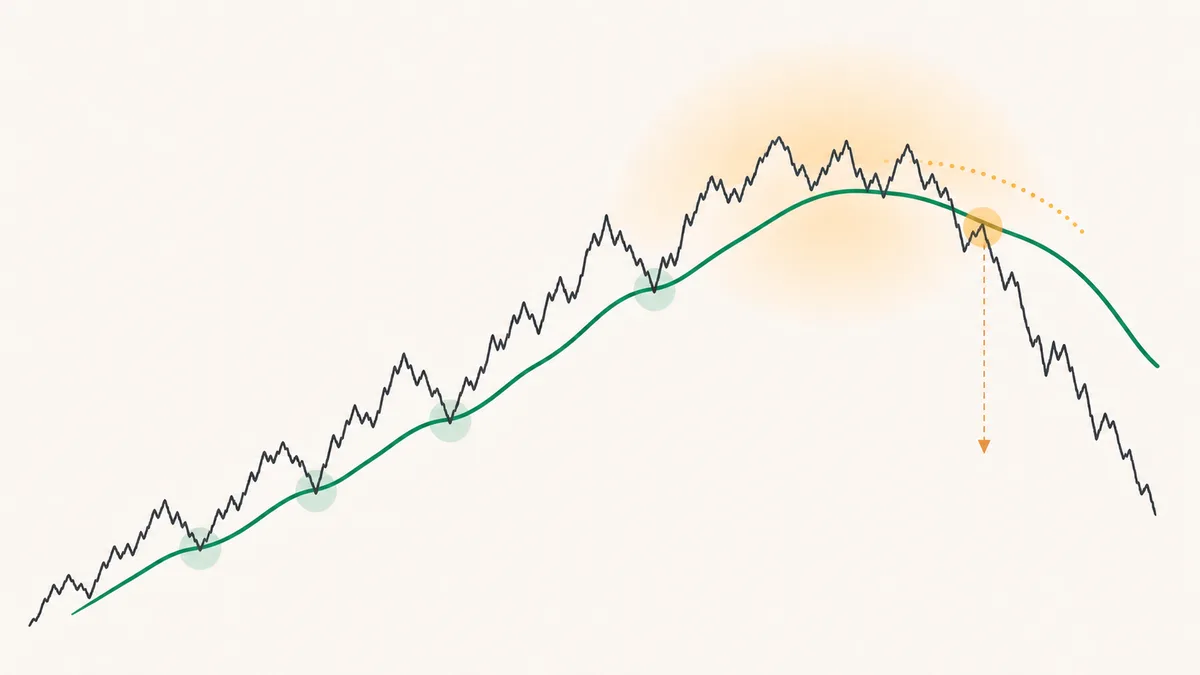
JMA (Jurik Moving Average) is a moving average that reacts quickly while keeping the curve smooth. During an active trend, it absorbs minor pullbacks well and shows the trend direction cleanly.
At turning points, however, that smoothness becomes a weakness. The price structure may already have broken down while the JMA line is still slow to turn. Use JMA only as a guide while a trend is in progress, and do not wait for JMA alone to call the turn. Confirm it together with other signals such as price structure, RSI, and MACD.
The right way to use it starts with separating its role. When the trend is still intact, treat pullbacks into the JMA as entry candidates. When the JMA starts to flatten, reduce new entries. If you wait until the JMA turns, you will usually recognize the reversal too late.

It is the most reliable guide while a trend is underway
When a trend is clearly in progress, JMA follows price with very little noise. Even when pullbacks appear inside the trend, the JMA barely wavers, so its slope holds steady. That makes it one of the cleanest tools for reading the current direction and strength of an active trend.
JMA can serve as a pullback-entry guide by smoothing small fluctuations. A deep pullback can still trigger a stop even while the trend remains intact. If you use 0.5–1 ATR below the line as a candidate stop, validate it against actual volatility and price structure.
After SOL breaks above $200 on the 4-hour chart in November 2024 and trends around $230-$250,JMA(14, 0, 2) maintains an upward slope,price pulls back into the JMA, then a candle closes back above it.Enter long at that candle’s close, with the stop 0.5 ATR below the JMA line.If the JMA slope clearly flattens or price closes below the JMA, treat the setup as invalid.
The key condition is that the trend must still be underway. JMA is strong at absorbing pullbacks inside a trend, but once the trend itself weakens, the same smoothness becomes a liability.

The Paradox of Smoothness — Turning Points Are Hard to See
When you make a moving average smoother, it absorbs major noise and major real changes in the same way. The same mechanism that filters false pullbacks also works during a real trend ending. As a result, even after the trend ends and price starts moving the other way, the JMA slope changes slowly.
After SPY made a high near $565 on July 16, 2024, the daily JMA(14) slope turned negative on July 18 (close $552.7), when price was already more than 2% below the high. EMA(14) turned down the same day, and the RSI close below 50 came a day later, on July 19. JMA’s smoothness cleanly absorbed the small pullback on July 11 without a false signal, but it absorbed the real trend reversal the same way, so recognition came later than price.
In this example, JMA turned on the same day as EMA and before the RSI close below 50, but price had already fallen from the high. This does not establish that JMA is the slowest of all indicators. Its limitation is that price can move first while you wait for a smooth line to turn.
Separate the roles. Check price structure and momentum together, and use JMA as a guide to the active trend. Signal order depends on settings and market conditions, so do not wait for JMA alone.

Phase — A Setting That Can Go Negative
JMA’s second parameter, phase, is a phase-adjustment value ranging from −100 to +100. At 0, lag and overshoot are about equal. As the value goes positive, lag falls but overshoot grows, and as it goes negative the pair moves the other way. Being able to take this value below zero is a major difference from EMA and SMA.
EMA has no way to reduce lag other than shortening the period. EMA(7) has less lag than EMA(21), but shortening the period also brings in noise. JMA, by contrast, lets you adjust lag directly through phase alone. On the same length of 14, phase=+50 reduces lag while the line stays smooth.
Adjusting phase to pull the line closer to price does not guarantee an earlier turning-point signal. Compare turn timing for settings including phase=+90 with EMA under the same conditions.
Phase is best used to fine-tune pullback entries during an active trend. As the JMA tracks closer to price, it creates more entry locations on smaller pullbacks. Raising phase to catch turning points is the wrong use of the parameter.
Length, Phase, and Power — The Overfitting Risk of Three Parameters
JMA has three adjustable parameters: length, phase, and power. EMA has one. That gives JMA three times as much room for fine-tuning to the same dataset, and it also clearly increases the risk of overfitting. A combination such as (14, +30, 2) may look strong in a backtest and then fail on the next dataset.
A practical rule is simple: if you optimize all three at once, the result is hard to trust.
- length: Choose within the 7-21 range based on the asset’s volatility cycle.
- power: Keep it fixed at 2, because its effect on smoothness is smaller than phase.
- phase: Fine-tune only within the -50 to +50 range.
By asset type, phase can be set like this. For assets with long, smooth trends such as SPY and QQQ, values near phase=0 usually work well. For assets such as BTC and ETH, where fast trends and deep pullbacks often mix, phase=+30 to +50 tends to fit pullback areas more often. For altcoins that are often range-bound, keep phase at 0 or negative to reduce false signals. Pushing it positive adds more false signals.
Reproducibility Problems From a Proprietary Algorithm
The original JMA algorithm is commercial and proprietary. Jurik Research is the only source for an official license, while TradingView community versions, MetaTrader ports, and open-source recreations are all reverse-engineered estimates.
You need to know two things. First, even with the same data and the same (length, phase, power), the line can differ slightly across platforms. A setup that worked well on TradingView may not line up at the same point in MetaTrader. Second, backtest results cannot be reproduced as directly as with EMA or SMA. Because the formula is estimated and implemented differently across platforms, the values vary slightly.
Before building a setup, always plot your platform’s JMA against EMA and DEMA on the same data at least once. Visually check how smooth the line actually is. If you copy someone else’s JMA setup exactly, you may not get the same signals.

JMA Is Not a Universal Tool
There is no statistical proof that JMA is always better than EMA. It can produce better results in smooth-trending conditions, such as strong trend phases in assets like SPY. But in fast-turning conditions, such as sharp altcoin moves or immediately after news events, it clearly performs worse than EMA.
JMA has a specific place where it works well. Use it only as a guide for following an active trend in low-volatility, smooth-trending conditions. Outside that role, it can produce worse results than simply using EMA.
The Three Most Common Ways JMA Is Misused
- Simple crossover entries: A JMA(7) crossing up through JMA(21) usually appears after the trend has already progressed some way. It has fewer whipsaws than an EMA crossover, but the entry is still late. Use the cross only to confirm trend direction, and judge the entry from a price-structure break.
- Trying to catch turning points with JMA: At a turning point, do not wait for JMA alone. Read it together with price structure, MACD, and the RSI 50 line. In this article's SPY example, JMA turned a day before the close below RSI 50, so do not assume the other signals are always faster. If you wait until JMA turns, you notice the end of the trend late.
- Raising phase too far: Push phase to +70 or higher and lag falls, but overshoot grows with it. If an asset often stops you out when you enter on a pullback, lower the phase. Raising phase gets you stopped out more often.
