OptiNod Academy
Overconfidence and the illusion of control — Small winning samples lead to bigger bets
Treating a short winning run as skill and feeling in control of the market can push bets beyond prudent Kelly limits. This overconfidence is measured by sample size and by the relationship between bet size and recent results.
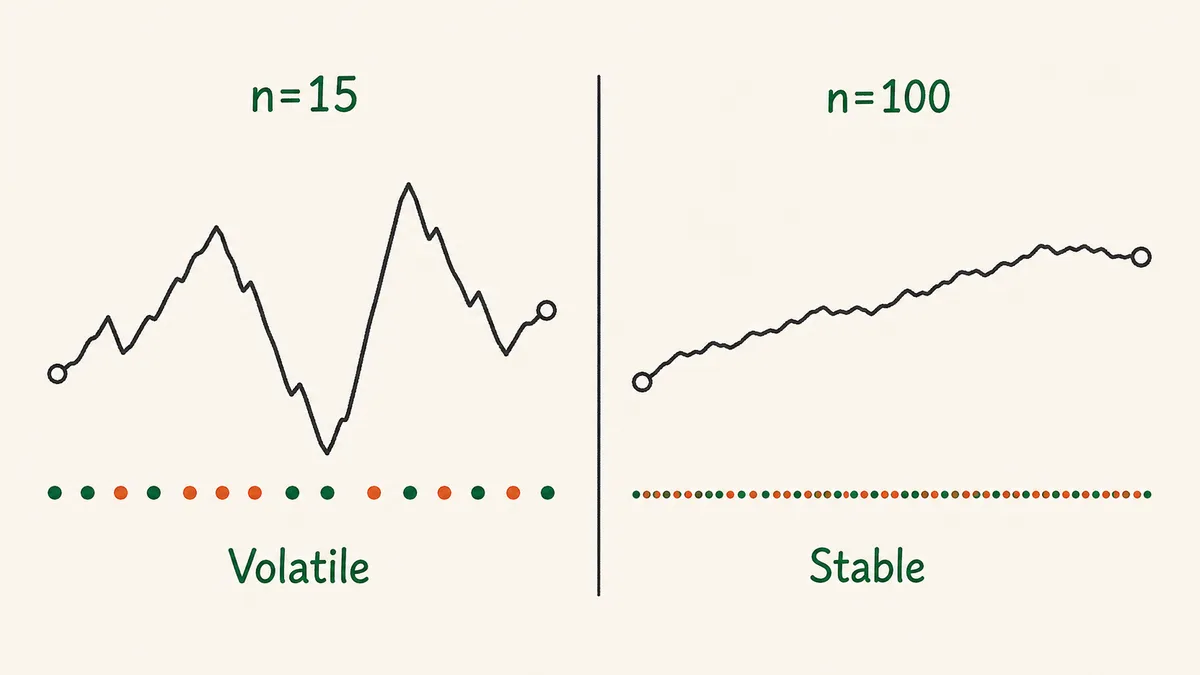
Increasing position size after several wins combines two mistakes: crediting a small sample of success to skill and believing your intervention controls the market. Trade count and the relationship between bet size and recent results can measure both.
The illusion of control was named by Ellen Langer in 1975. It describes a tendency to feel that personal involvement raises the chance of success above the objective probability, even when outcomes depend on chance. In Langer's experiments, people bet more when they threw dice themselves and valued lottery numbers they selected more highly. Overconfidence works alongside it. Self-attribution bias credits winning trades to one's skill and losing trades to the market, so certainty can rise rapidly during a winning streak.
This is often described simply as “confident trading.” Treated as a virtue, confidence leaves nothing to correct. Overconfidence is not a personality flaw; it is the specific behavior of treating success from a small sample as proof of skill and translating that belief into larger bets. It does not appear when the signal's edge objectively improves. It appears after a few favorable outcomes and can be seen numerically in trade records.
The cost begins with bet size. Twelve wins in 15 trades produce an observed win rate of 80%, but a 95% confidence interval for the true rate in such a sample runs roughly from 0.55 to 0.93. The true rate could be 0.55. At even-money reward and risk, the Kelly fraction is twice the win rate minus one. Using 0.80 suggests risking 60% of capital; using 0.55 suggests 10%. Two readings of the same small sample produce a sixfold difference in the calculated bet size. That is where overconfidence becomes costly.

Crediting wins to skill raises certainty on too little evidence
Self-attribution bias applies different standards to success and failure. Winning trades are credited to analysis and entry timing; losing trades are blamed on market noise or luck. During a streak, confidence can therefore grow faster than actual skill.
Market conditions strongly affect a winning sample. Bitcoin rose about 67% from its April 7, 2025 low of $74,508 to $124,474 on August 14. During those four months, many long entries would have closed profitably. If a trend-following trader won eight or nine trades in a row then, the streak does not by itself measure the edge of the entry signal. It is also a record from a period when the baseline probability of a profitable long was temporarily high.
Missing that distinction leads to larger bets. A trader who sees the streak as proof of skill increases the next position. In a 2000 study of roughly 66,000 individual-investor accounts, Barber and Odean found that the most active fifth earned a net annual return of about 11.4%, well below the market index's roughly 17.9%. Overconfidence can increase trading and bet size; the cost shows up in returns. A streak is too small a sample to justify certainty.

The illusion of control makes intervention feel effective
Frequent intervention can create a feeling of control over results. Watching a position tick by tick, repeatedly moving the stop, and adding or trimming in parts make the outcome feel personally steered. Langer's experiment illustrates the problem: throwing the dice yourself does not change which number appears, and repeatedly adjusting a position does not change the next bar's direction.
The illusion appears in position size. A trader following a sizing rule risks a fixed account share per trade, for example defining 1R as 1% of capital. Position risk then does not depend on recent performance. Under the illusion of control, the opposite happens: after wins, “I have the market figured out” leads to higher risk percentages; after losses, they fall. Recent N-trade results become correlated with the risk percentage on the next trade. The farther that correlation is from zero, the more sizing is responding to confidence rather than the rule.
Turning confidence into a bet can exceed the Kelly limit
The Kelly formula estimates the bet fraction that maximizes long-term growth given an edge and a reward-to-risk ratio. At 1:1 reward to risk, it equals twice the win rate minus one: 55% yields 10%, and 60% yields 20%. In practice, even that is often too large, so half-Kelly is a common ceiling. See the Kelly criterion.
Overconfidence pushes beyond that ceiling. If you overestimate the win rate from a small sample, the Kelly result itself is inflated. Add an illusion of control, and the actual bet may be larger still. Betting twice the Kelly-optimal fraction drives long-run growth to zero under the formula's assumptions; larger bets can shrink capital over time despite a positive edge. Oversizing directly raises risk of ruin.
That cost can appear in one decline. After reaching about $126,200 on October 6, 2025, Bitcoin fell roughly 36% to $80,600 by November 21. If a trader who raised the bet during a winning run was 3x long near the high, just getting stopped out loses 3R at once. If they took the full 36% drop with no stop, the loss is larger than that. With more leverage, liquidation comes closer and may leave no room to wait for a rebound. One loss can erase much of the profit from the prior eight wins.
Three figures in the trade record reveal overconfidence
Mindset alone cannot diagnose overconfidence. Put bet size beside sample size and examine three figures.
First, sample size and a confidence interval. Count how many trades the recent success came from, and calculate a confidence interval for that sample's win rate. The standard error is the square root of the observed win rate times one minus that rate, divided by the sample size. So when the observed win rate is 80% and the sample size is 15, the full width of this normal-approximation 95% interval widens to about 0.4 (about 0.2 on each side), and when the sample size is 100 that width narrows to less than half. When the sample is small, the normal approximation is inaccurate. The 0.55–0.93 in the introduction is a Wilson interval for a small sample; the roughly 0.4 here is the width of the normal approximation. The smaller the sample, the weaker the basis for confidence.
Second, the relationship between bet size and recent results. Record the risk percentage of each trade and check whether that value correlates with the results of the previous few trades. With fixed-fraction sizing, the risk percentage is constant. Because fixed-fraction sizing keeps the risk percentage the same every time, the only thing to check is whether the risk percentage ever rose after a winning streak. A record of the risk percentage rising after a winning streak is evidence that the illusion of control was at work.
Third, the Kelly ratio: actual bet fraction divided by the half-Kelly amount calculated from your estimated win rate and reward-to-risk ratio. Above one exceeds the half-Kelly ceiling; above two passes the full Kelly optimum, where long-run growth starts to decline. All three can be calculated when the trade list includes risk percentage and the sampling period.

A fixed ceiling keeps confidence out of sizing
Overconfidence acts by increasing bets precisely when confidence feels high. The remedy is to separate position risk from that feeling. A ceiling fixed in advance cannot be raised merely because of a winning streak.
- Fix a risk-per-trade ceiling: Keep position sizing at a fixed account share, such as 1%, regardless of winning or losing streaks. Treat half-Kelly as a ceiling, not a target to exceed.
- Check the minimum sample: Before trusting a new edge, require a minimum number of trades, such as 30, and examine the confidence interval. Do not increase bets below that sample.
- Automate sizing rules: Calculate risk percentage before entry, set limit price and quantity, and do not increase the position arbitrarily afterward.
- Build a single-symbol sample: Rather than raise confidence from a short run, collect more trades on the same symbol to narrow the interval.
- Review weekly: Calculate the association between recent results and risk percentage, and the Kelly ratio. If the ratio exceeds one, revisit the ceiling.
These rules do not aim to force larger profits. They keep bet size separate from confidence and limit risk to an edge supported by the sample.
Two pitfalls
Treating a winning streak as proof the edge increased. Raising size because you won several trades dresses the illusion of control as a rule. A bull-market streak may simply reflect a temporarily high baseline chance for profitable longs. That chance can fall when conditions change. Re-estimate the win rate only after collecting samples across distinct market conditions.
Using Kelly as permission for a large bet. Its result depends on the win rate and reward-to-risk ratio supplied. Inflate those estimates through overconfidence and the formula itself becomes an excuse for oversized bets. Kelly is a ceiling when the true win rate is known; with a small sample, use the lower part of the confidence interval conservatively.
Overconfidence is visible in sizing records
Overconfidence is hard to spot while you are winning. Larger bets increase profits during the streak and reinforce certainty. The cost appears all at once on the first large loss after market conditions change, by which time position size may already be beyond the Kelly ceiling. To catch the sequence earlier, do not rely on how confident you feel. Count the trades behind recent success and review the association between risk percentage and recent results, along with the Kelly ratio. Tie position size to sample evidence and a fixed ceiling, and rising confidence is less likely to turn one loss into a concentrated hit.