OptiNod Academy
Gartley Pattern: B Retracement Failure and D Reaction Decide the Trade
Read the Gartley through B-point retracement failure, PRZ confluence, and the reaction at D. Memorizing 78.6% is not enough.
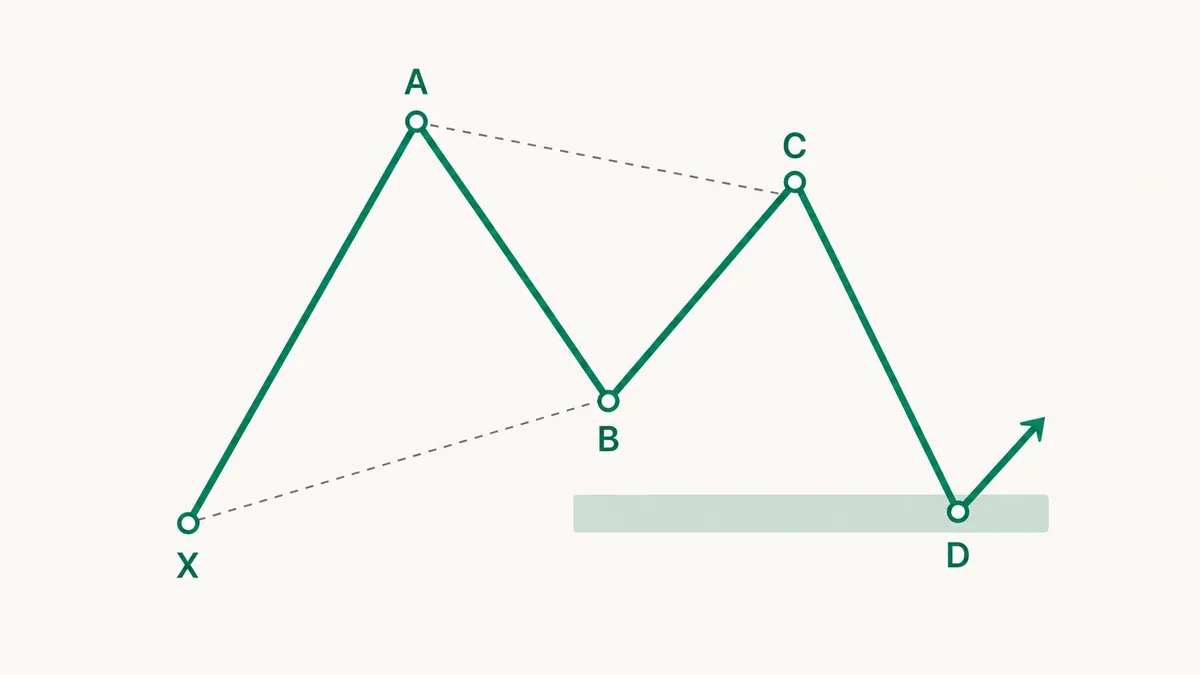
A Gartley is a structure where the rebound weakens at B and the reversal can be confirmed at D with limited risk. It is easy to assume that price must reverse simply because it touches 78.6%, but the Gartley reads how B and C behave before price reaches that area.
The Gartley is often one of the first harmonic patterns traders learn. That makes it easy to memorize the XABCD shape and the 78.6% retracement, then move on. The key point is how B and C behaved before price reached that area. Whether D touches exactly 78.6% matters far less.
A good Gartley appears after XA, when B does not retrace too deeply and the C bounce also fails to fully recover the prior move. The final D only matters when it forms inside a tight PRZ where the XA 78.6% candidate overlaps with AB=CD or a BC extension.
So the Gartley should be checked in order: B's retracement limit, the width of the D PRZ, the first reaction, and the invalidation level. Reaching D by itself is not a reason to enter.

B Should Stall Near 61.8%
In a strict Gartley, B is normally the 61.8% retracement of XA. In live trading, however, the 50-70% zone is usually treated as acceptable. What matters is that price retraced a meaningful part of the first move without fully reversing the starting structure. The exact decimal is secondary.
If B is too shallow, the structure can be confused with a Bat, which has a shallow retracement. If B reaches too close to X, the Gartley loses its balance. At that point, it may be better interpreted as a Butterfly or an incomplete double bottom or double top.
That is why the first judgment is made at B, before D arrives. If B stalls within 50–70% of XA and the following C does not pass beyond A, treat it as a Gartley candidate.

D Is a Confluence Zone Where Several Ratios Meet
The Gartley D point is defined by several ratios meeting in one area, with the XA 78.6% retracement as just one of them. A good D brings the XA retracement, BC extension, and AB=CD candidate into the same area. A 78.6% level without confluence does not mean much.
PRZ width is the gap from the highest D candidate to the lowest D candidate. This article's setup requires that gap to fall inside 0.7 times ATR(14). The PRZ playbook also reads the same gap as about 1.2% of the current price. If the zone is wide, the trading levels stay hard to set even when the XABCD structure fits.
The advantage of the Gartley is that D stays within the X boundary. This makes invalidation easy to define around X, and it lets you cap risk with only a small buffer outside the PRZ.

Enter Only After Price Reacts at D
The fact that price has reached the D zone is not enough. D is only an area where a reversal may occur. With harmonic patterns, the decision to enter should come after you see the price reaction at D. A tail, an engulfing candle, or a small high/low shift must confirm the setup.
In a bullish Gartley, look for price to pierce the lower side of the PRZ, then close back inside the zone, followed by a pullback that holds the D low. In a bearish Gartley, look for price to pierce the upper side of the PRZ, then return inside the zone, followed by a bounce that fails to break the D high.
After XA, B stalls in the 50-70% range, and C fails to recover A.At the D candidate, the XA 78.6% retracement, BC 1.27-1.618 extension, and AB=CD overlap within 0.7 times ATR(14).Price pierces the PRZ, then the next candle closes back inside the zone.Entry is taken at the close of the return candle or on a defended retest of the PRZ.Place the stop 0.3 ATR outside the PRZ. If that level is beyond X, use just outside X as the stop.If price closes beyond X, abandon the Gartley interpretation and exit.
For a bullish Gartley, place the conservative first target at a 38.2–50% recovery of the CD decline. Taking half off there reduces exposure if the D reaction ends as a simple bounce. The second target is point C, a 100% recovery of the CD decline. Confirm whether price recovers C before separately assessing further upside.
The Most Common Trap Is Mixing Bat and Gartley
Gartley and Bat patterns look similar because both complete with D inside X. The difference is the depth of B and D. If B is shallow and D is closer to 88.6%, it is more natural to read the structure as a Bat.
Missing this distinction can distort stop placement. If you enter at 78.6% thinking it is a Gartley, but the market is actually building a deeper Bat-style D point, you may get stopped out before the pattern completes. Worse, you may average down to lower your cost basis and end up trapped in a larger position.

Another trap is selecting XABCD structures that only look correct on a completed chart. Once the chart is finished, almost any swing can be made to resemble a Gartley. What matters in real time is whether D is reacting now and whether the invalidation level is close.
Once X Breaks, the Gartley Is Over
The Gartley is built on the premise that D completes inside X. So if price closes below the X low in a bullish pattern, or the X high is reclaimed in a bearish pattern, the structure has changed into something else.
If you widen the stop to defend the Gartley at that point, you lose the main advantage of the harmonic setup. A Gartley is a pattern designed to risk only a small loss around X. Do not treat it as a completed pattern that must work. Once X breaks, assume the pattern you expected may have been wrong. Look for the next pattern after that.
