OptiNod Academy
Elliott Wave Mastery, Part 1: Turning a Count Into a Trading Plan
Turn a wave count into a trading plan with an entry, stop, conditions for reducing size, and invalidation rules.
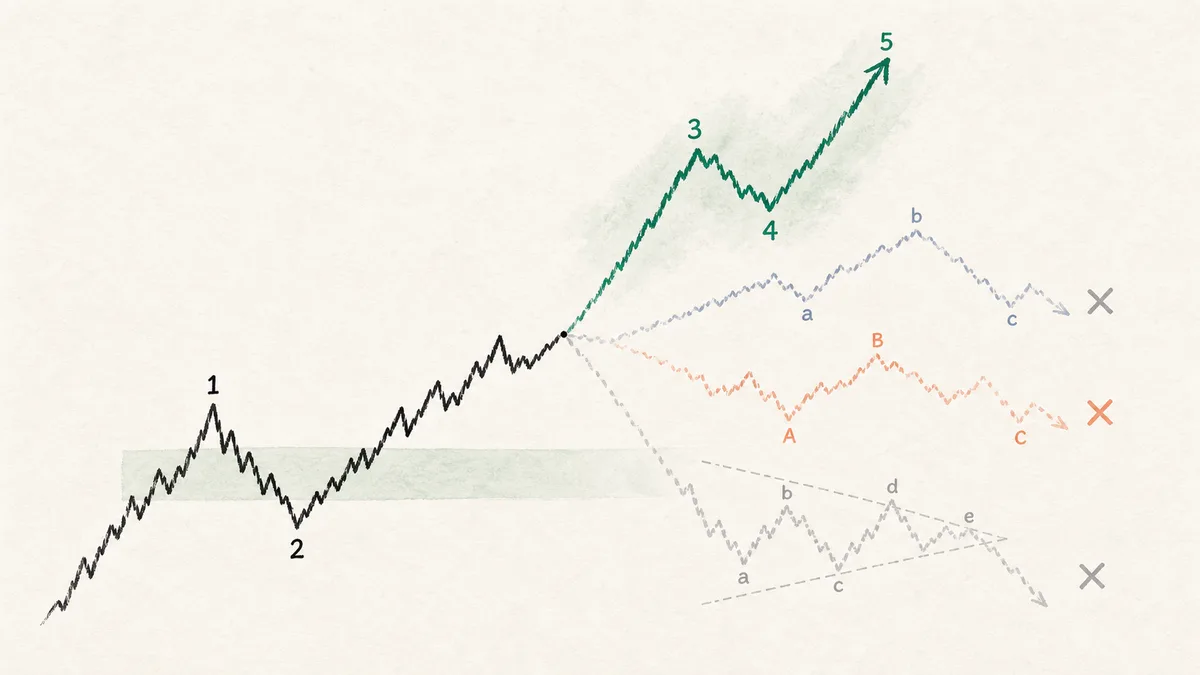
Before debating whether the count is right, the entry price, the stop price, the condition for cutting size, and the condition for throwing it out are written down first.
Marking an Elliott Wave count on a chart and trading from that count are two different jobs. On a historical chart, choosing the cleanest count may be enough. In real time, you cannot know whether the current count is correct, and the structure can change as soon as the next candle prints.
That is why, in live trading, a count should work like a checklist. Your current scenario, entry price, stop price, conditions for reducing size, invalidation rule, and alternative scenario should all fit on one line. If any of these are missing, you may have analysis, but you do not have a trading plan.
This article explains how to connect Elliott Wave analysis to actual positions. The process is to keep only scenarios that are still valid, define the conditions for entering wave 3 after waves 1 and 2, reduce size when the move is too slow, and filter out lower-timeframe noise.

Keep Only Scenarios That Are Still Valid
Elliott Wave charts become messy when traders fail to remove counts that have already been invalidated. Even if a count was once possible, it should come off the chart once price breaks the stop level, the move takes too long, or required conditions are not met.
A still-valid scenario must answer three questions. First, if it is correct, what should price do next? Second, if it is wrong, what price invalidates it immediately? Third, can you tolerate the loss to that price?
A count that cannot answer those three questions stays as a side note only. The live chart keeps only the scenarios tied to the current trade. Then the next candle is handled by the rule already set. A new reading does not have to be built every time.
A Wave 3 Entry After Waves 1 and 2 Needs Three Conditions
The most practical Elliott Wave setup is a potential wave 3 after waves 1 and 2. The direction has just started, the stop is relatively clear below the wave 2 low, and if the count is right, the reward can be large because wave 3 may extend.
Waves 1 and 2 looking confirmed is not an immediate entry. Three conditions have to line up at once: a break of the wave 1 high, a retest that holds after the breakout, and the wave 3 time condition. If even one is missing, the trade can get caught in a false breakout or a complex correction.
In a bullish scenario, the wave 1 high is 100 and the wave 2 low is 88.Price closes above 100, then retests the 98-101 area within the next 1-3 candles.If the retest closes back above 100, that is the entry.The stop is set 0.3 ATR below the wave 2 low.This is this article's operating standard. If wave 3 has not risen to at least 1.0 times the length of wave 1, and 1.5 times the time wave 2 took has passed, the position is cut in half.If price closes below the wave 2 low, the impulse scenario is dropped.
The advantage of this setup is a clear place to get out when the count is wrong. If the wave 2 low is far away, the entry is smaller, or the trade waits for the retest. In Elliott Wave, a good entry comes from a count whose stop is close. Whether the count looks clean comes after that.

If the Move Takes Too Long, the Count Weakens
Many traders focus only on the stop level in Elliott Wave trading. But a move that takes too long is also an important warning sign. If it is wave 3, it should expand quickly. If it is a triangle, the compression should keep narrowing. If it is wave C, it should move at a pace similar to wave A.
Even if price has not touched the stop, the scenario loses credibility when too much time has passed. Holding the same size through that is a poor choice. When the move runs late, the position is reduced, adds are stopped, and the next confirmation is what the trade waits for.
Quantifying this article's time and price criteria makes the decision easier. Treat a wave 3 candidate as weak if its price range, measured from the end of wave 2, fails to reach at least 1.0x wave 1's price range within 1.5x the time taken by wave 2. Reassess a wave C candidate if it takes more than 2x wave A's time while still failing to reach 0.8x wave A's length. These are this article's position-management criteria, not absolute Elliott rules.
Lower-Timeframe Counts Are Only for Entry Timing
You can find five waves on a 5-minute chart, five waves on a 1-hour chart, and five waves on a daily chart. If you give all three the same weight, your analysis will keep shifting. Lower-timeframe counts are for entry timing. Higher-timeframe counts define direction and stop placement.
For example, if the daily chart is still in a wave 3 extension, you should not open a large short position just because a small five-wave divergence appears on the 15-minute chart. That small five-wave move may be a minor correction inside the daily wave 3. Conversely, if the daily chart is a possible exhausted wave 5, a small five-wave decline on the 15-minute chart carries more weight as an exit signal.
The higher timeframe is sorted out first. The daily chart sets direction, the 4-hour chart sets structure, and the 1-hour chart sets the entry. That order is the one that has to hold. A count that looks good on the entry timeframe but fights the higher structure is cut in size or put on hold.

Use Fibonacci to Calculate Stop Distance First
In Elliott Wave analysis, Fibonacci is often used to set targets: wave 3 at 1.618x, wave 5 at 0.618x, and so on. In live trading, however, it should first be used to calculate stop distance and risk-reward before setting targets.
If wave 2 stops at a 61.8% retracement and price breaks the wave 1 high, it becomes a wave 3 candidate. But if the stop sits below the wave 2 low, you must first calculate the distance from entry to stop. If the reward to the 1.618 target is less than 2R, it may be a good count, but it is not a good trade.
Fibonacci targets are used as levels for splitting the position. Part of the position is taken off at 1.0 times, more at 1.618 times, and anything beyond 2.0 times is left only when the trend is very strong. Risk comes off at each target zone.
Your Trading Journal Should Have Only Three States: Hold, Reduce, Exit
In live trading, the count is not reinterpreted at every moment. In the journal, the current count is managed in only three states: hold, reduce, and exit.
- Hold: The stop level is intact, the move is not late, and the wave conditions are still valid.
- Reduce: Price has not broken the stop, but the move is late or momentum has weakened.
- Exit: Price has broken the stop level, required conditions have failed, or an alternative scenario has become more likely.

This makes Elliott Wave trading much simpler. Simply decide whether its current state is hold, reduce, or exit, and skip the constant debate over whether the count is correct. As a result, you reduce the cost of holding a wrong count for too long.
A Good Count Has a Clear Stop
Elliott Wave is powerful because it explains chart structure well. That also makes it dangerous. The more convincing the explanation sounds, the easier it is to delay the stop. A good count does the opposite: it makes the stop clearer.
Before entry, four lines are always written down: the entry price, the stop price, the condition for cutting size, and the condition for throwing the scenario out, plus the alternative to watch after that. Without those four lines, the count is not a trading plan.
Traders who use Elliott Wave well quickly delete wrong counts and test only the surviving counts with small risk. That difference drives real trading performance.