OptiNod Academy
Trend Efficiency — 69% of 4-Hour Windows Measured on 15-Minute Bars Are Chop, So the HTF Filter Comes First
Most of what looks like trend on the 15-minute chart is, statistically, chop. When OptiNod measured 6.72 years of BTC 15-minute bars, about 69% of 4-hour windows had a trend efficiency below 0.3, and only 8.6% were clear trends. This piece lays out why polishing your trend signal buys little when 70% of the time it fires the market is chopping, how to make higher-timeframe (4H·1D) alignment a precondition for entry, and the switch-over rule that turns chop into mean-reversion territory.
Most moves that look like trends on the 15-minute chart are statistically chop. The 8.6% figure measures 4-hour windows with efficiency above
0.5, separately from higher-timeframe (4H/1D) EMA alignment. Check both efficiency and alignment before acting on a 15-minute trend signal.
Trend efficiency (efficiency ratio) is a simple ratio defined by Perry Kaufman. It divides the net move connecting the start and end of a window by the total path every bar in between traveled. Close to 1 means price moved in one direction in a near-straight line; close to 0 means it shuttled back and forth over the same ground, piling up path without going anywhere. It expresses, in one number, whether you are in a trend or a range. That said, this ratio is a diagnostic for reading the market state, not an indicator that produces the entry moment itself.
Popularly, this indicator is introduced alongside ADX as a "trend-strength filter": use trend-following when efficiency is high, mean-reversion when it is low. That is correct. The catch is that most traders put this indicator directly on their own trading timeframe — the 15-minute or 5-minute chart — and use the moment it crosses 0.3 there as a trend entry signal. They are repurposing a diagnostic tool as an entry signal.
The problem is that on a single 15-minute timeframe, most of the windows where efficiency briefly rises are, seen more broadly, just one leg inside a range box. Mistake that leg for a trend and chase it, and you get caught by the pullback at the far end of the box. From here, one step in how you look at the chart changes. When you see a clean advance on the 15-minute, before entering you will first check whether the 4H and 1D are aligned in the same direction.

69% of 4-Hour Windows Measured on 15-Minute Bars Have Efficiency Below 0.3; 8.6% Exceed 0.5
When OptiNod measured 235,571 BTCUSDT 15-minute bars (September 2019 to May 2026, about 6.72 years), about 69% of 4-hour windows had an efficiency below 0.3. That means chop. Trend windows with efficiency above 0.5 were only 8.6% of the total. Widen the window to one day and about 97% fall below 0.3. Measure the path on 15-minute bars, though, and a longer window piles up the round trips, so efficiency tends to come out lower. Do not read the same 0.3 as chop of the same strength on the 4-hour and the 1-day.
What this distribution says is clear. In almost every moment you have the 15-minute chart open, the market is statistically in a range. Pick trend-following entries at random and seven times out of ten you board a chopping leg that soon reverses. This is exactly why a well-built trend-following strategy keeps hitting stops on the 15-minute: most of the windows where its rules fired were not trends.
From an operational standpoint, this number forces one thing. Refining the trend signal itself further buys you little, because 70% of the windows where it fires are chop anyway. The first thing to do is to attach a condition that filters out that 70%.

A Month and a Half Shuttling Across the Same Price Zone Is, by Efficiency, Not a Trend
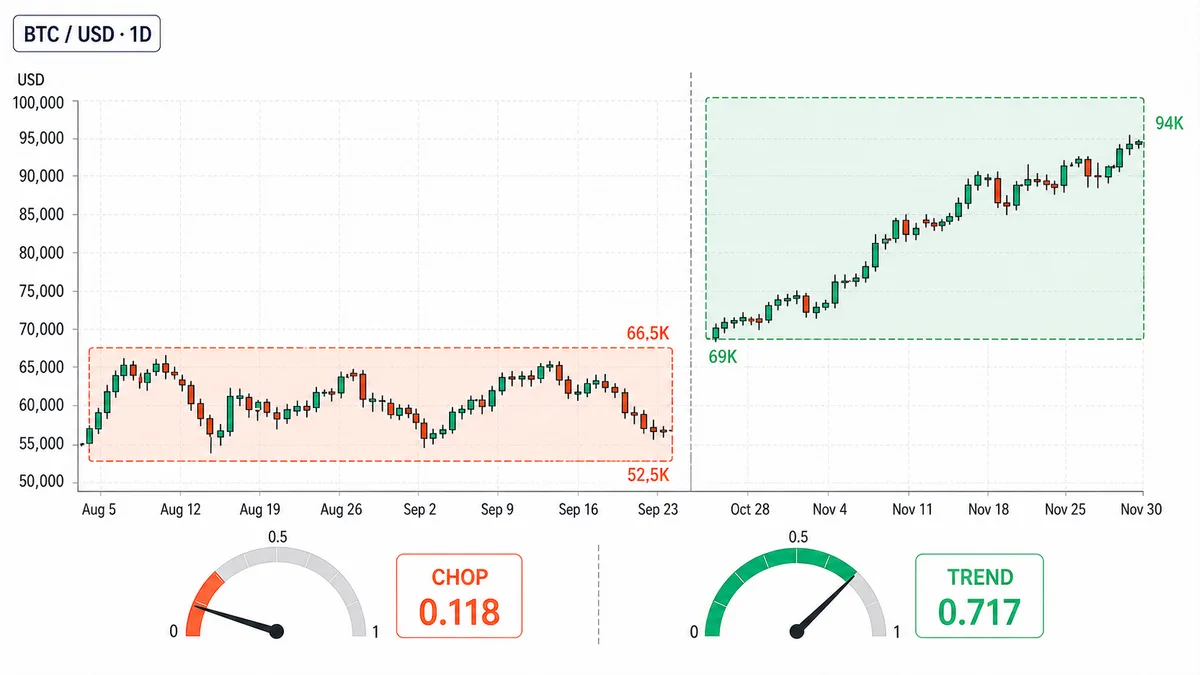
Let us see in price terms how an abstract ratio actually splits. From the August 15, 2024 close of $57,541 to the September 30 close of $63,327, over about six weeks, the BTC daily chart logged a net rise of $5,786. Over that span the high was $66,498 and the low was $52,550. It ranged $13,948 up and down, ending with a net move of $5,786. The total path of this window was about $49,038, and dividing the net move by the total path gives an efficiency of 0.118. Clear chop.
The efficiency of this August window and of the November window below was calculated from the daily high, low, and close. The 69%, 8.6%, and 97% in the previous section were measured on 15-minute paths over a 4-hour or 1-day window, so the same 0.3 is a different unit of measurement. A trader watching the 15-minute chart inside this window would have felt the late-August bounce, the early-September decline, and the mid-September re-bounce each as a trend. Every time there was a rationale for a trend-following entry. Yet those legs were all internal round-trips inside the same box, and the single number — efficiency 0.118 — makes that fact plain at a glance.
The contrast makes the difference vivid. After the November 5, 2024 U.S. election, BTC rose from the close of $69,372 to the November 20 close of $94,286. Computed the same way, the efficiency was 0.717. August's 0.118 and November's 0.717 are the same asset, the same daily chart, yet the outcome of trend trading splits completely. The first thing on the chart that separates the two is this efficiency number. In a low-efficiency window, trend-following stops are normal, and that is not the place to doubt your system.
A Brief Clean Advance Within the 15-Minute Is Noise on a Daily Basis
Drop to a shorter timeframe and the problem gets worse. Look at the single day of September 9, 2024 as 96 fifteen-minute bars: BTC opened that day at $54,870 and finished at $57,042. It rose about $2,172, so by the result alone it was an up day. Yet over that day the total path the 15-minute bars traveled was about $10,919, and the efficiency was 0.199.
It shuttled five times the net-move distance all day, and only one-fifth of that went in one direction. Someone watching the 15-minute chart this day would have felt "a trend was caught" once in the morning and once in the afternoon, because each time a short clean upward leg was drawn cleanly. The local efficiency of each of those legs was high, but the efficiency tying the whole day together was 0.199 — chop. What looks like a trend on a small time window is, on a larger window, most often one cycle of an oscillation.
This is the structural limit of a standalone 15-minute signal. On a small time window, anything looks like a trend, because if you magnify noise enough, it appears to have direction. So if you leave the judgment to 15-minute efficiency alone, entry signals keep firing throughout the 70% of the time the market is chopping. The wider the measurement timeframe, the closer the efficiency value comes to the real state of chop.
Making HTF Alignment a Condition Cuts Trades, but You Take Trend Signals Only in That Window
The concrete way to attach the condition is higher-timeframe (HTF) trend alignment. In OptiNod's measurement, the time the 4H EMAs were in bullish alignment (20>50>200) was 39.9% of the total, bearish alignment was 34.0%, and neither was 26.1%. On a 1D basis, bullish alignment is wider at 47.5%. Make this alignment state a precondition for entry and you only act on 15-minute signals during the periods when the trend is holding.
Look at the unconditional average. The forward return of BTC 15-minute bars is structured so that a mild long drift accumulates as you lengthen the horizon, and the probability of being up (P[>0]) rises along with the horizon as well.
| Forward window | Mean return | P[>0] |
|---|---|---|
| 4 hours out | +0.022% | 51.0% |
| 1 day out | +0.131% | 51.8% |
| 1 week out | +0.930% | 53.2% |
The table above is the unconditional average. This article does not split returns between bullish-alignment windows and the rest, so do not conclude that the drift is concentrated in the aligned windows. The alignment condition is an operating rule: keep only the hours when the 4-hour and the daily stay in the same direction, and take 15-minute signals inside that window.
The cost is trade frequency. The 8.6% share of windows with efficiency above 0.5 is neither the EMA alignment share nor this setup’s eligible-entry share. Combining efficiency and alignment reduces trades, but the reduction requires measuring the intersection separately. See multi-timeframe filtering and trend-following vs mean-reversion.

In Chop, Stop Trend Entries and Switch to Mean-Reversion
Attaching an entry condition that reduces trades does not mean throwing away all that time. The 70% of the time with low efficiency is unfavorable for trend-following entries. That same time actually suits mean-reversion that targets both ends of a box. Using that same ratio — trend efficiency — you switch between two strategies depending on the window.
The judgment splits like this. If the 4H is in bullish alignment and a pullback forms on the 15-minute, you prepare to enter in the trend direction. Conversely, if the 4H is not aligned (the 26.1% window) and efficiency is below 0.3, you hold off on trend-following entries and switch to targeting both ends of support and resistance. The same 15-minute signal is interpreted completely differently depending on the higher-timeframe state. Read the size of volatility with ATR and a secondary check of trend strength with ADX alongside it, and you avoid clinging to the single number of efficiency alone.
Below is the setup for allowing a trend-following long. Alignment and efficiency are stacked to filter chop. Do not read the share of time that meets every condition as 8.6%. Measure that share separately.
- Premise (alignment condition): Treat a bar as a long candidate only when both the 1D and the 4H are in bullish
EMA20>50>200alignment. - Entry: When, with the alignment condition met, 15-minute price makes a pullback to the 4H
EMA20and then breaks above the high of the prior 15-minute bar. - Stop: Below the prior 15-minute swing low, or below the 4H
EMA50, whichever is nearer. If the stop distance exceedsATR×1.5, reduce the position size accordingly. - Invalidation: If the 4H close breaks the
EMA50, treat the trend premise as broken and exit immediately. If the prior 4-hour window's efficiency drops below0.3, halt additional entries. - Take-profit / management: First take-profit (50% of the position) at the prior 4H swing high; hold the remaining 50% until the 4H
EMA20is breached.
Reading Efficiency and Alignment Together Keeps You from Mistaking a Chop Stop for a System Flaw
Efficiency and higher-timeframe alignment reduce range entries; they do not eliminate stops. A trade that passes the filters can still lose in chop or a regime change. One stop alone does not establish a system defect or filter failure.
Before entering, check the following in order.
- Are the 1D and 4H
EMA20>50>200in bullish alignment? This setup does not take shorts on bearish alignment. - Is the prior 4-hour window's trend efficiency above
0.3(below0.3, treat it as chop and hold off on trend entries)? - If ATR% — the 15-minute ATR divided by price — exceeds this article's high-volatility line of
0.451%, did you reduce the position to the stop distance? This article does not say which sample or which percentile 0.451% comes from. - Have you ruled out, on the 4H chart, the possibility that the 15-minute signal is one leg of an internal round-trip inside a box?
August’s efficiency 0.118 and November’s 0.717 occurred in the same asset within three months, which motivates this filter. Both windows may look tradable on the 15-minute chart alone, but efficiency statistics and EMA alignment provide different information. Check both before entry.
