OptiNod Academy
Wyckoff Method — Three Laws and the Composite Operator (Large-Player Hypothesis), Part 1
The real tools of the Wyckoff Method are the three laws applied bar by bar and the Composite Operator hypothesis. This first article in the series explains why the four-stage labels are just labels that emerge after those two tools have been applied over time.
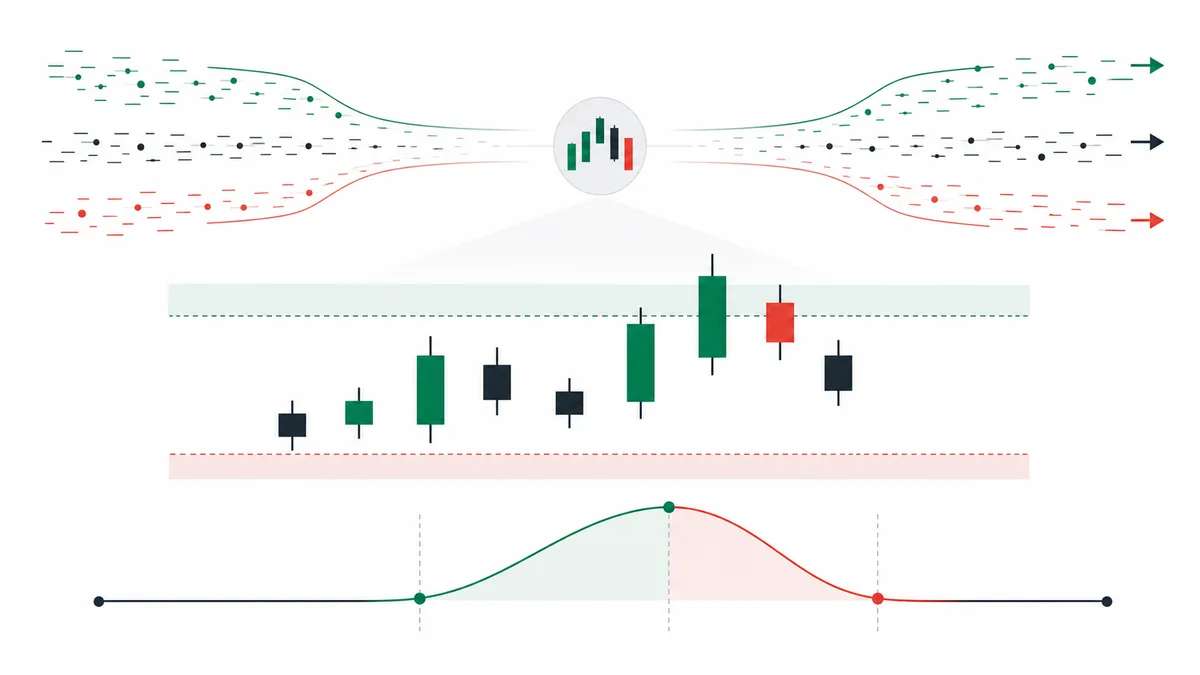
In Wyckoff, the tools you actually use are the three laws applied to each bar and the Composite Operator concept, which reads the whole market as one actor. The four-stage labels are names attached only after those two tools have been used to read the bars one by one.
Richard D. Wyckoff (1873-1934) founded The Magazine of Wall Street around 1907. The original name was The Ticker. In 1931 he published the correspondence course The Wyckoff Method of Trading and Investing in Stocks. He put into one book the intuition that late-19th-century New York Stock Exchange (NYSE) floor traders used when they read volume bar by bar beside the tape.
This is the first article in the Wyckoff Method series. Part 1 covers the three laws and the Composite Operator concept. Part 2 is accumulation from stage A through stage E. Part 3 is the distribution stage. Part 4 is Tom Williams's volume and bar-range analysis, and Weis Wave. Part 5 covers crypto and algorithmic markets, Part 6 the schematic, and Part 7 the Wyckoff scanner.
The popular reading compresses Wyckoff into one line: a four-stage cycle of accumulation, markup, distribution, and markdown. Terms such as preliminary support, selling climax, automatic rally, Spring, and the upthrust after distribution get introduced as if they were all of Wyckoff. Those stage labels are closer to classifications attached after the fact. The label can be fixed only after the cycle has finished, and it is hard to put any label in advance on a bar that is still forming.
The tools Wyckoff kept repeating through the course are separate: the three laws of supply and demand, cause and effect, and effort and result, plus the Composite Operator concept, which reads the whole market as one rational actor. Once those two foundations are firm, labels such as spring and the upthrust after distribution follow naturally on top of them.

Law 1 — Supply and Demand means reading volume on every bar
The first law says: when supply is greater than demand, price falls; when demand is greater than supply, price rises. Wyckoff turned this statement into a practical trading tool by treating each bar's volume as a direct record of the supply-demand balance inside that bar.
A single bar contains the open, high, low, close, and volume. If a bar closes near its high on heavy volume, demand overwhelmed supply during that bar. If a bar closes near its low on heavy volume, supply overwhelmed demand. To read the supply-demand balance of a bar, you have to look at volume together with where the close sits inside the bar's bar range.
If price rises 3% on only 0.5 times the average volume of the prior 20 bars, the move is closer to a light push caused by sellers stepping away. If the same 3% rise occurs on twice the average volume, it looks more like an advance driven by new capital. A bar becomes meaningful only when price change and volume are read together.
SPY opened with a gap down on August 5, 2024, during the unwind of the yen carry trade, at $511.6, about 4% below the prior close of $532.9, and the volume of that bar rose to about 2.8 times the prior 20-day average. It closed at $517.4, a recovery to the 53% point between the high and the low. Under Law 1, supply poured in early in the bar, but large demand absorbed it. SPY then began recovering on August 8 and set a closing high of $570.98 on September 19. If volume had stayed near the average, that bar would have been read as a simple dead-cat bounce.
Law 2 — In Cause and Effect, trend size is proportional to range size
The second law says that cause determines effect. For Wyckoff, the cause is the volume accumulated during a sideways range, and the effect is the size of the trend that follows after price leaves that range.
Wyckoff measured this law with a Point and Figure chart. Point and Figure erases the time axis and stacks X boxes for rises and O boxes for declines from price movement alone. The number of boxes that build sideways during a range (the width) is proportional to the vertical extent of the next trend (the price target). This measurement is called the Point and Figure count, and the later part of the course is given over to this count.
Fewer traders draw Point and Figure directly these days, but the intuition of the law still holds. A short range tends to lead to a short trend. A long range tends to lead to a long trend. Price moves only as far as the cause that was built.

NVDA moved sideways for roughly four months from July to October 2023 in a $390-$500 range (pre-split prices), then rose about 180% from the top of the range over about eight months, from November 2023 to June 2024, reaching the area near $1,400. By contrast, after the same stock moved sideways for roughly two months from August to September 2025 in a $164-$185 range, it broke out on September 30 and rose only about 14% in roughly four weeks, to a high of $212. A four-month cause led to an eight-month effect. A two-month cause led to a four-week effect.

Law 3 — Effort and Result Asks Whether Volume and Price Agree
The third law is the statement that effort and result must agree. Effort is volume. Result is price change. If heavy volume produces only a small price change, someone inside that bar is taking the other side.
When Laws 1 and 3 are used together, the meaning of a single bar falls into four cases.
- Heavy volume + large price change: trend continuation
- Heavy volume + small price change: absorption or reversal
- Light volume + large price change: no resistance (usually a whipsaw or a temporary wobble)
- Light volume + small price change: uninformative bar
The second case is the one traders most often miss: a bar with heavy volume but very little price movement.
BTC's March 14, 2024 bar, which made a new high near $73,800, is that case. Daily volume was about 1.2 times the prior 20-day average, and the bar range was wide at about $5,200, but the close of $71,389 finished below the open ($73,072), near the middle of the bar. On the following March 15, volume rose to about 1.7 times the 20-day average, yet the close fell further to $69,500. The added volume failed to drag price up by a matching amount. This is a classic mismatch of effort and result. BTC then ranged for about seven months between $49,000 and $73,800, and the new high was not renewed until November 2024. One bar's mismatch of volume and price showed the seven-month range in advance.

Composite Operator — Viewing the market as one actor
The core of the Wyckoff Method is the Composite Operator concept. It asks you to read every decision in the market as if one rational actor made it. This actor controls large capital, so building or unwinding a position takes time. The concept is not a conspiracy theory. Whether such a single entity actually exists is beside the point. It is a thinking tool: if one rational actor were drawing the chart, then each bar would carry intent.
The behavior follows two principles.
- Enter and exit slowly: Large positions are not built or closed all at once. The operator enters slowly and exits slowly to avoid shocking the market.
- Move price: Once the position is built, price must be moved away from the entry area so the position can later be sold to someone else.
The four-stage cycle follows naturally from these two principles: Accumulation, Markup, Distribution, and Markdown.

Seen this way, a range is where the actor is building or unwinding a position. Even while price appears stalled, decision-making is at its most concentrated. BTC stayed in a roughly $24,800-$31,800 range for about four and a half months from June to October 2023. That period can be read as a quiet accumulation phase, and after the range breakout on October 23, BTC rose about 132% to a high of $73,777 on March 14, 2024.

The four-stage cycle is a label assigned after the fact
The four-stage cycle — accumulation, markup, distribution, markdown — is an after-the-fact classification that falls naturally out of how the Composite Operator acts. The detailed names inside each stage are specific events in the cycle. Selling climax, spring, sign of strength, and the upthrust after distribution are examples. Part 2 on accumulation and Part 3 on distribution cover them stage by stage.
The point to stress in Part 1 is that the four stages are a classification you can attach only after they have passed. A diagnosis such as "we are in accumulation stage B" is confirmed only after the chart has gone far enough. If you label a bar that is still forming, confirmation bias takes over and every bar that does not fit gets ignored as noise. The tool you actually use is the Law 1 and Law 3 reading of each bar. Once those bars pile up, the cycle label follows on its own.
A Wyckoff diagnosis is a label that describes the market's current state. Entry timing is determined by a separate trigger. This separation between diagnosis and entry is what makes the Wyckoff Method practical in live trading.
Applying the Three Laws Bar by Bar Creates the Simplest Entry Trigger
As an entry trigger, the three laws become one line: heavy volume, a strong closing location, and accumulated sideways action all appearing on the same bar. These three conditions map directly to Law 1, volume; Law 3, agreement between volume and price; and Law 2, accumulated cause. When one bar satisfies all three conditions at once, that bar can be read as one where the Composite Operator executed part of an entry or exit.
SPY trades sideways for at least the prior four weeks in a $460-$470 range (Law 2 condition),then one bar prints volume at 1.8 times or more of the prior 20-day average (Law 1 condition),and that bar breaks the range high ($470) on a closing basis, with the close finishing in the upper 30% of the bar range (Law 3 condition).Enter long at the close of that same bar. Set the stop below the midpoint of the range at $465.If price closes back inside the range within five bars after entry, or if volume falls below average, treat it as a false breakout and exit.
The key is that all three conditions must line up on the same bar. The bar on which BTC closed above the top of the prior four-week range ($23,900-$29,800) on April 11, 2023 did not meet the standard. Volume was 0.96 times the prior 20-day average. The close sat at the 64% point measured from the bottom of the bar range, short of the upper 30%. The close was back inside the range within six days, and eight weeks later the close was about 10% below the breakout close. By contrast, when the same asset broke the range ($16,300-$18,000) on January 12, 2023, 2.8 times volume, a close at the 78% point from the bottom of the bar range, and four weeks of accumulation all showed up on the same bar, and within eight weeks of that break the high was about 34% higher. The Wyckoff Method is strong in live trading because it keeps the discipline of taking as entry candidates only the bars where the three conditions arrive together.
Three traps — Common ways traders misuse Wyckoff
- The label-first trap: This is the habit of putting stage labels such as spring or the upthrust after distribution on the chart first, then forcing each bar's reading to fit the label. The order is backward. The Law 1 and Law 3 reading of each bar comes first, and the label is attached only after those readings pile up. Label first, and confirmation bias takes over: every bar that does not fit gets ignored as noise.
- Wyckoff without volume: The foreign exchange market has no central exchange, so total volume cannot be measured. Volume in some small altcoins is inflated by wash trading, making Wyckoff interpretation itself meaningless. Wyckoff cannot be used on assets where volume cannot be trusted.
- Treating the Composite Operator like a person: Conspiracy-style explanations such as "the big players deliberately pushed price below support to shake out retail traders, then lifted it again" move away from Wyckoff's actual emphasis. Real markets consist of millions of distributed decision-makers. If you treat them as one literal person, you start attaching conspiracies to every false breakout and build the habit of blaming losses on outside forces.
Two filters that strengthen Part 1's framework
Adding two supporting tools to the bar-by-bar use of the three laws cuts down false signals.
- Higher-timeframe confirmation: A Law 1 signal on the daily chart carries much more weight when it is confirmed by a Law 1 signal on the weekly chart. Even if SPY breaks out of a range on the daily chart with heavy volume and a strong close, if the weekly bar is still inside the range, the daily signal should be treated as short-term movement. The signal carries the strongest weight as a Composite Operator decision when the daily and weekly charts confirm the same Law 1 direction at the same time.
- Minimum time-in-range filter: Setting a minimum accumulation period for entry setups, for example "only ranges that have moved sideways for at least four weeks qualify," raises the average quality of signals. Breakouts from short ranges offer smaller expected reward for the same capital and stop distance, which lowers the average performance of the full series.
The three laws plus the Composite Operator concept in Part 1 are the foundation under every stage name from Part 2 on. Memorize only the labels above that foundation, and the Wyckoff Method turns into a tool that adds a commentary after the move is already over.
