OptiNod Academy
Stochastic — A Closing-Price Position Oscillator
Know that it is reliable only in a trading range, and first classify the regime by where the %K/%D cross occurs: the upper zone, the middle, or the lower zone.
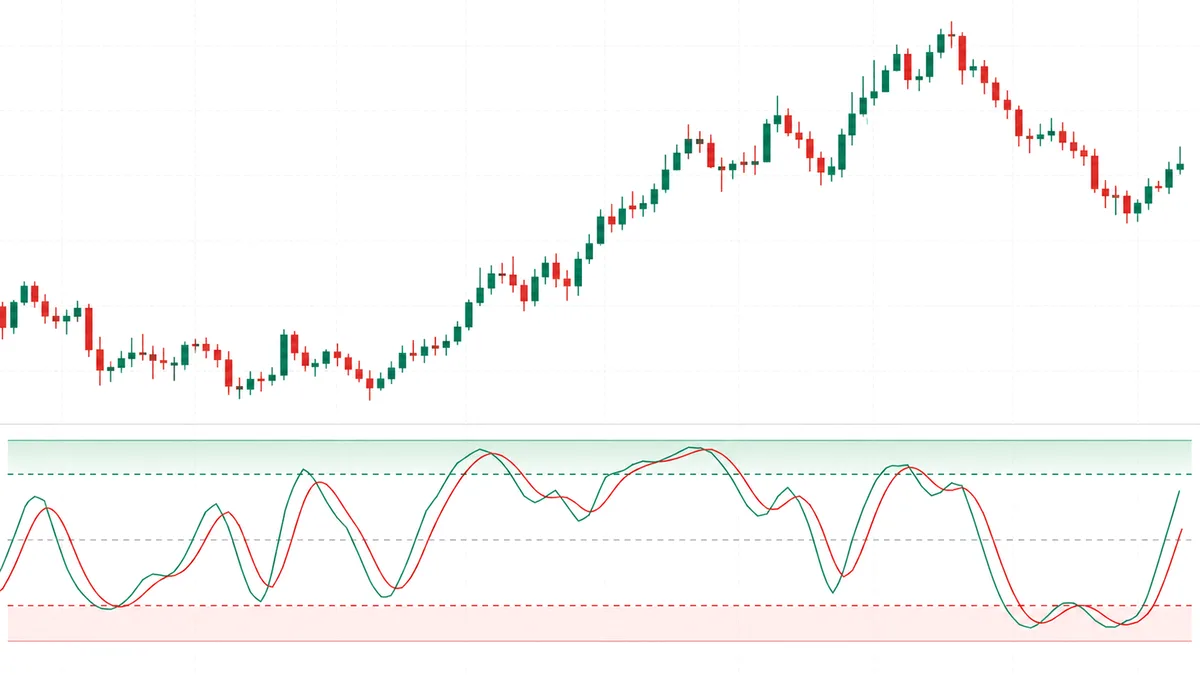
Stochastic shows where the current close sits within the range of the previous N candles. There are two lines: %K and %D, its 3-bar average. When %K is above 80, it means price is at the top of the recent range. That is not, by itself, an overbought sell signal; look at the regime first.
In a strong uptrend, closes can keep hugging the top of the recent range. If you read every move above 80 as a sell signal, you will keep entering against the strongest part of the trend. In a range, however, a rollover crossover above 80 can be a valid short candidate.
The sequence matters: classify the regime first. Check how many candles %K spends above 80, and where the crossover appears: the upper zone, the middle, or the lower zone. Then separate range, trend, and shock regimes. Entries come after that.

What Lane Really Emphasized Was Divergence
In interviews, George Lane, who created the stochastic, often complained that his tool was being taught as a simple “sell at 80, buy at 20” rule. What he emphasized was divergence, especially the spot where price makes a new high or a new low and %K fails to follow. His core claim was this: if price makes a new high and %K does not follow up, that is a sign the trend is cooling.
But Lane also said something else: “This tool does not work well in trending markets.” Whether you are using divergence or an 80 sell rule, you must first determine whether the market is range-bound. Signal interpretation comes afterward. If you skip regime classification, every method breaks down.
This is the first fork in using Stochastic: is the market ranging or trending? The same %K=80 has opposite meanings in those two regimes.

How Long %K Stays Above 80 Defines the Market
Look at the share of candles in the previous 30 to 50 bars where %K stayed above 80. That one number can summarize the current regime.
- 0-10%: Range-bound market. %K rarely reaches 80, so when it does, it becomes a short candidate.
- 10-30%: Weak trend or late-stage range. Mean-reversion setups become less reliable.
- 30% or more: Strong uptrend. Turn off the 80 sell rule. It is normal for %K to stay locked above 80, and a break back below 80 becomes the meaningful signal.
Run the same analysis using the share of candles below 20 to identify downtrends. If both sides are below 10%, the market is range-bound. If one side is 30% or higher, it is trending.
After NVDA gapped up on earnings on February 22, 2024 (close of $785, +16% from the prior day) and broke through the $700s, daily %K was often locked above 80 through March 7. As of March 7, the above-80 ratio over the prior 30 candles was about 77%. Traders using an 80 sell rule had to re-enter at higher prices again and again. If they had checked the ratio first, they would have turned off 80 sells and switched to pullback-buy setups.

Stochastic Pop — When Staying Above 80 Signals a Strong Trend
In the 1990s, Jake Bernstein identified a pattern in Chicago futures markets. After a range, %K breaks clearly above 80 and does not come back down. Under the standard interpretation, this is already “overbought,” yet price continues higher for several days to several weeks. The sell signal becomes the entry signal.
%K shows where the current close sits in the N-bar range. Holding above 80 means the close is in the upper 20% of that range. It does not mean a new high is made on every bar, so confirm an actual range breakout and price structure as well.
A Pop forms only when four conditions appear together. Most moves above 80 do not qualify.
AMD’s daily chart has spent a month in a range, and %K(14,3,3) has not been above 80 during the previous 30 candles.Price moves on a large bullish candle at least 1.5 times the daily ATR, and %K breaks clearly above 80.Volume on that same candle is at least 1.5 times the previous 20-candle average.%K remains above 80 for the next 2 to 3 candles.Enter long at the close of the Pop confirmation candle, the third candle holding above 80.Place the stop below the low of the candle that started the Pop.If %K closes back below 80, the Pop is over, and the setup is considered wrong.
If any one of those four conditions is missing, it is closer to a false breakout and should not be treated as a Pop. If %K already spent time above 80 within the previous 30 candles, the second entry is harder to trust. A slow move up to 80 without a volume expansion also fails the Pop conditions.
The opposite pattern, a 20 Pop, applies the same logic in reverse: if %K breaks below 20 and stays there for several days, it signals a strong downtrend.

The Meaning of a %K/%D Crossover Depends on Location
A %K/%D crossover by itself carries little information. The area where the crossover occurs gives it meaning.
- Bullish crossover in the lower zone, 0-20: The cleanest long setup in a range. Price is near the bottom of the range, %K dips below 20, then crosses above %D and recovers above 25. This is where the conditions for mean reversion are strongest.
- Bearish crossover in the upper zone, 80-100: A short setup in a range. The key is confirming that the market is clearly range-bound. If you mistake a Pop for an upper-zone crossover, you will keep shorting into the middle of a trend.
- Crossover in the middle zone, 40-60: Almost no information. In a range, it is mostly noise. In a trend, it is normal fluctuation inside the trend. Avoiding crossovers in this zone is the first filter.
Inside a strong trend, the same crossover means something different. After a Pop, if %K pulls back toward 50 and then crosses back above %D, that is a trend pullback buy. It looks similar to a range mean-reversion buy, but the market state is different, so the entry meaning and trade management are different.

Fast vs Slow — Why Smooth Twice
Fast Stochastic shows the raw %K and its SMA(3), the %D line. Slow Stochastic smooths the raw %K again with an SMA(3) and uses that as the new %K, then applies another SMA(3) to create %D. In the standard 14,3,3 setting, the middle 3 is %K smoothing, and the final 3 is %D smoothing.
Fast fell out of standard use for a simple reason. On 5-minute and 15-minute charts, Fast crosses come very often, and most of them end as meaningless noise. This article did not count that frequency or that ratio from a sample. Slow smoothing filters noise and raises the share of usable signals. In the era of paper charts, traders could not keep up with Fast signals manually, so Slow became the standard. That choice still holds.
The best settings differ by asset. On SPY daily, 14,3,3 works cleanly. For a more volatile asset like BTC daily, 21,5,5 reduces more noise. For extremely volatile assets such as DOGE or SHIB, some traders extend it to 30,5,5. If 14,3,3 creates too many signals on your asset, it is reasonable to lengthen the period. But make that change only after checking it with at least one backtest.

Three Regimes Where the Same Signal Works in Reverse
- Selling above 80 in a trend: If you do not understand Pop, you will keep entering against the trend. Before enabling 80 sells, check the above-80 ratio over the previous 30 candles. If it is 30% or higher, turn off the 80 sell rule.
- Entering on divergence alone: Even the divergence Lane emphasized can repeat two or three times inside a strong trend while price keeps rising. Divergence is a warning. It becomes actionable only with confirmation, such as a close below the 50 line or a test of higher-timeframe resistance.
- Using Fast on short timeframes: Fast Stochastic on 5-minute and 15-minute charts is mostly noise. The shorter the timeframe, the more you should favor Slow. If there are still too many signals, increase the setting to 21,5,5. If you turn on Fast hoping for earlier signals, false signals increase at the same rate.
Two Higher-Level Confirmations
To trust a Stochastic setup, two things should line up.
- Higher-timeframe trend: A 1-hour Pop is more reliable when it matches the direction of the 4-hour trend. If the 4-hour chart is in the middle of a range and only the 1-hour chart shows a Pop, it is more likely to be short-term volatility.
- Price structure: A lower-zone crossover matters only when price is actually at the bottom of the range. If price is in the middle of the range and only %K has dipped below 20, you entered before price reached the range floor, and your stop expands by the remaining distance to that floor.
