OptiNod Academy
Liquidity Sweeps — Targeting Clusters of Stops
Stops tend to build just beyond obvious highs and lows. When price pierces those levels and then returns, it can be a strong reversal signal. Use only sweeps that align with the larger trend.
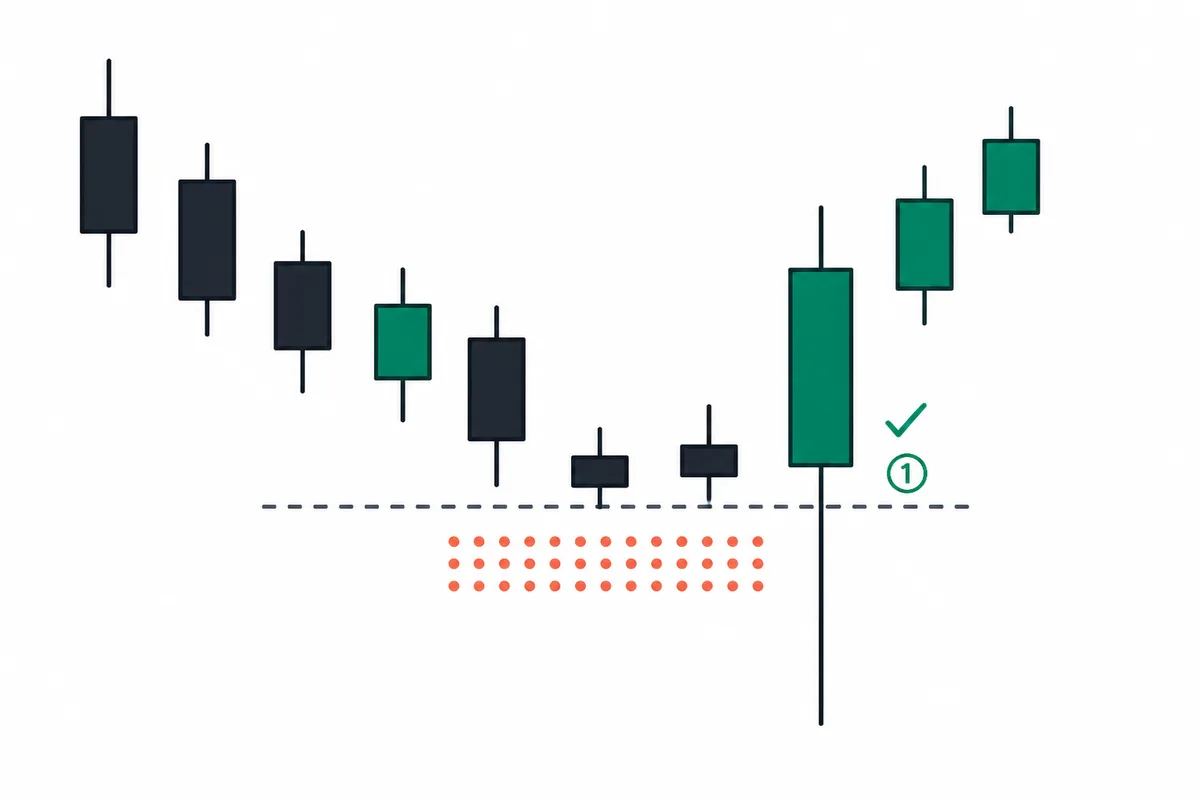
Stops tend to cluster just beyond obvious highs and lows. Those stop clusters are where large players can find liquidity, and when price pierces them and then snaps back, it can become a strong reversal signal.
In earlier articles, we looked at support and resistance, supply and demand zones, and market structure. Now we will look at liquidity sweeps, which occur around the edges of that structure. Here, liquidity means pending orders in the market, especially stop-loss orders.
Stops do not cluster randomly. Most traders place them in similar locations: just above the prior swing high, just below the prior swing low, or near round numbers such as 30,000 or 50,000. Because everyone uses similar reference points, stops build up heavily around the same levels.
When large players need to buy or sell size, they need enough opposing orders to fill that size. Areas with dense stop clusters are where those opposing orders can appear all at once, which is why price often moves toward them.
When price pierces those levels, stops trigger in a chain reaction and price can move sharply for a short time. Once that stop liquidity is consumed, price often returns in the original direction. That pierce-and-return sequence is a liquidity sweep.

Why Large Players Target Liquidity
If a large player buys aggressively at market, price gets pushed higher and the buyer pays worse prices. To fill a large order, they need a place where someone else is willing, or forced, to sell enough size. A dense stop cluster can provide that place.
Buyers' stops sitting below a low become market sell orders when price reaches them. At that moment, sell orders hit the market all at once, and a large buyer can absorb that flow to fill its buy order. This is how price can briefly push below a low, trigger stops, use that sell liquidity to fill its buy order, and then move back up.
Whether this is intentional manipulation or a natural crowding effect cannot be proven from the chart alone. What matters is that the same footprint remains: price pierces a stop area and then returns. You do not need to decide the cause. You only need to respond to the structure.
Stops Cluster Where Everyone Looks
Stop placement is fairly predictable. Buyers usually place stops below the prior swing low, where their trade idea breaks down. Sellers place stops above the prior swing high. Round numbers play the same role. Because people anchor decisions around clean numbers such as 30,000 or 50,000, orders tend to gather near them.
The problem is that everyone follows the same logic. Just below a low that everyone can see, there is often a layer of stops placed by everyone watching that same chart. Large players can see that level just as clearly.
Liquidity tends to build around a few common areas: prior swing highs and lows, two or more equal or nearly equal highs or lows, round numbers, and the high or low of a day or week. The more obvious the level is on the chart, the thicker the stops beyond it are likely to be.
Equal Highs Make the Area Above Them a Target
When two or more highs form around the same level, stops tend to build more heavily above them. Sellers who see those highs often place their stops just above the level. That makes the area one of the most likely places for stop liquidity to cluster.
BTC in the summer of 2023 is a good example. From June through July, BTC repeatedly stalled around $31,000 to $31,500. On July 13, price briefly pierced that zone and reached $31,804, triggering stops above the prior highs. By the close of the same day, it had fallen back to $31,454.
The next day, BTC dropped to $29,900. It continued to drift lower through the summer and reached the $25,000 area in August. That single move above the highs was a liquidity sweep that consumed upside stops. This example illustrates the upper-sweep shape, not an automatically eligible short entry. Consider a short only if the weekly bearish direction is confirmed under the operating rules below.
The same logic applies to lows. When equal or nearly equal lows sit side by side, stops build below them. If price pierces below those lows and then recovers, it becomes a bullish liquidity sweep.

The Close and the Reclaim Separate a Sweep From a Real Breakout
To decide whether a move above a high or below a low is a liquidity sweep or a true breakout, watch the close and the speed of the reclaim. If the close comes back inside on the same bar or the next bar, it is a liquidity sweep. If it closes beyond the level and holds there, it is a real breakout.
BTC on September 11–12, 2023 is the downside example. The reference support was near $25,300. On September 11 the low was $24,901 and the close was $25,162.52, still under that support. The next day's close, $25,840.10, reclaimed the level. The sweep did not finish inside one bar. It played out across two bars.
The speed of the reclaim is another clue. A move that fills stop orders in one burst — what traders usually call running the stops — pushes in fast and snaps back fast. If the close stays beyond the level for several days, that is a real break. Volume helps too. If volume on the breakout bar spikes and then fades quickly, the stops were filled in one shot.

The Reclaim After the Sweep Is the Entry Signal
The value of a liquidity sweep is in the reclaim. The entry comes when price consumes the stops and closes back in the original direction.
Wyckoff's Spring has the same structure. Price briefly drops below the bottom of a range, consumes stops, and quickly returns inside the range. That recovery is the buy signal. Whether the level is the range low, a prior low, or a round number, the structure is the same: price briefly moves below the stop cluster and then returns.
The key is not to enter during the pierce. That short window, when stops are triggering in a chain reaction, is volatile and directionally unclear. Wait until the recovery is confirmed by the close.
The buy candidate is the September 12 candle closing at $25,840 and reclaiming support, not the September 11 breakdown candle. Place the stop below the breakdown low, under $24,900. If price later closes back below that level, treat it as a real breakdown and exit.
Use Only Sweeps That Align With the Larger Trend
Not every sweep is an entry signal. Only sweeps that align with the larger trend matter. When the weekly chart is in an uptrend, a daily sweep below a low followed by a recovery can offer a strong long entry. When the weekly chart is in a downtrend, a sweep above a high followed by failure can offer a short entry.
A sweep that runs against the larger trend tends to reclaim only briefly, then keep going in the direction it broke through. In an uptrend, a move above a high is often the start of a real breakout. In a downtrend, a move below a low is often a sign that the decline is continuing.
Because countertrend sweeps can easily turn into true breaks, entering for a reversal can leave you caught in the trend. Before looking for a sweep, define the direction of the larger trend.
How to Trade a Sweep
- Entry condition: The weekly chart is in an uptrend. On the daily chart, price pushes below the prior swing low, or a round number, with a long lower tail. The same candle or the next candle then closes back above that low.
- Entry: Buy at the close of the candle that confirms the reclaim.
- Stop: Place the stop below the end of the tail the sweep made.
- Invalidation: If price closes below that tail low, treat it as a real breakdown and exit.
The most common mistake with sweeps is chasing during the pierce. In that moment, stops are triggering and price moves quickly, making the direction look obvious. Then price reverses. Another mistake is treating every tail as a sweep without checking the larger trend. A tail that runs against the larger trend is often the start of a real break. A sweep becomes a signal only after you identify both the stop cluster and the direction of the larger trend.
The advantage of a sweep entry is that invalidation is clear. The end of the tail that broke out is the invalidation point. Use that distance as 1R and apply the position-sizing method from the previous article to determine size.
Understanding liquidity sweeps also changes how you place stops. The level everyone uses, such as just below the prior low, is also the level most likely to be reached. Placing your stop slightly away from that cluster, where a tail is less likely to reach, can help keep you out of the most obvious target zone.