OptiNod Academy
Ichimoku Cloud: Five Lines and the Cloud
Focus on the Chikou Span and the future thickness of the cloud to identify trend starts and ends one step earlier.
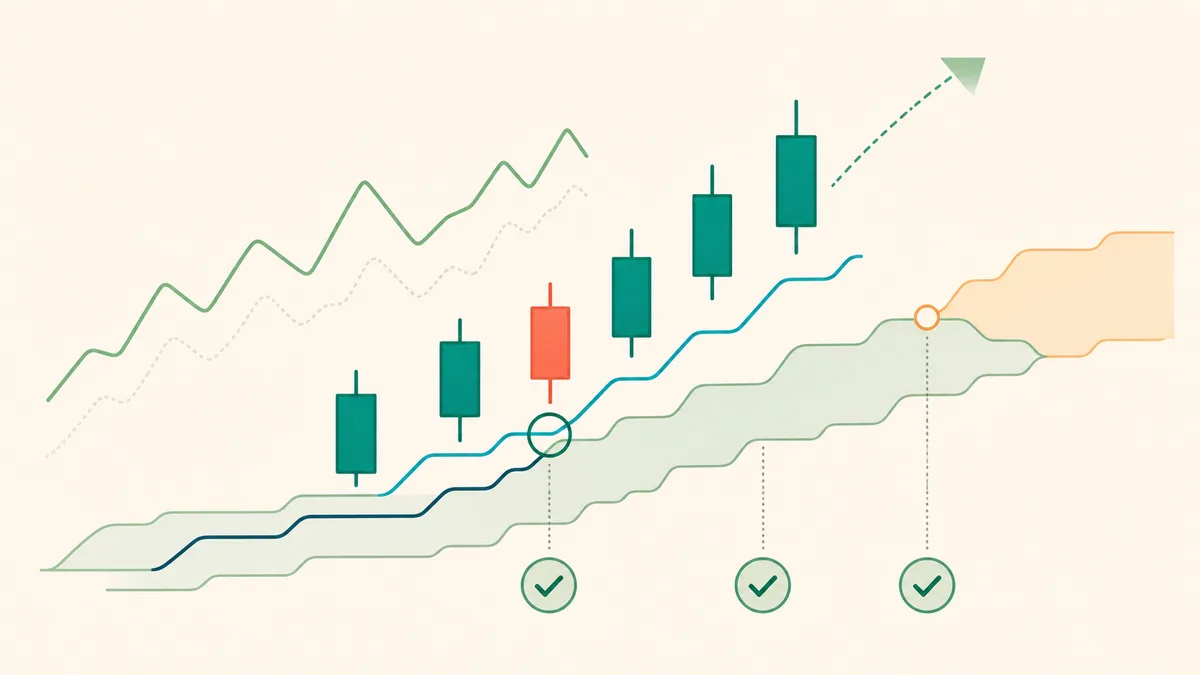
If you use Ichimoku as simply "buy when price is above the cloud," you will get far too many signals. In practice, you need to confirm whether price, the Tenkan-sen, the Kijun-sen, and the Chikou Span align on the same candle.
The three conditions of Sanyaku Koten are price above the cloud, Tenkan above Kijun, and the Chikou Span breaking upward out of the high-to-low range of the candle 26 bars ago. When all three are met on the same candle, it is a bullish setup. When all three fail, it is a bearish setup. If only one or two fit, leave it unfinished and do not chase it.

Keep 9-26-52 as the Baseline and Test Changes
9, 26, and 52 are the standard Ichimoku settings. Some readings explain these numbers with Japan's old six-day trading calendar, but that alone cannot be treated as the settled intent of the founder, Goichi Hosoda (Ichimoku Sanjin). His successor, Tetsuo Hosoda, describes 9 and 26 as basic numbers in time theory.
The elapsed time covered by 26 candles depends on the market and timeframe. Stock daily charts count trading days; crypto daily charts count consecutive dates. Extending the periods to match a calendar month does not automatically make an Ichimoku setting more accurate.
Use 9-26-52 as the baseline in crypto too. Changing 26 to 31 and 52 to 62 is only a candidate for comparison, not a required correction that preserves the original intent or a recommended superior default.
Before adopting a change, compare it with the baseline using the same data and entry and exit rules, then check whether results hold after costs and across other market periods. A different trading calendar alone is no reason to change the settings or abandon Ichimoku.

Cloud Thickness Determines Support and Resistance Quality
The cloud, or Kumo, is the area between Senkou Span A and Senkou Span B. In English-language usage, traders usually focus only on whether price is above or below the cloud. In Hosoda's original framework, however, cloud thickness matters more.
The cloud is bounded by two lines. Tenkan is (highest high + lowest low) / 2 over the last 9 bars, and Kijun is (highest high + lowest low) / 2 over the last 26 bars. Senkou Span A is (Tenkan + Kijun) / 2, and Senkou Span B is (52-bar high + 52-bar low) / 2. The calculated Senkou A and B are plotted 26 bars ahead, on the right side of the chart, so the right edge already shows 26 bars of cloud that price has not touched yet. The cloud is the area between those two lines, and its thickness is the difference between Senkou A and Senkou B (A−B). The thicker it is, the more clearly the short-term and long-term averages differed at that price. The thinner it is, the more those two time horizons are converging.
The cloud's value as support or resistance is proportional to that thickness. A thick cloud is a heavy zone where price often has to pause and choose direction again. A thin cloud reflects little disagreement in the market, so price can pass through it with little resistance.
Toyota (7203) passed through a thin cloud when its daily chart climbed back above the cloud in May 2025. The cloud was less than 1.5% thick on a closing-price basis (1.1% on May 13) and did not act as meaningful resistance. Price crossed it in a single candle. When the same asset reached a thick cloud on September 24, 2024, with thickness of 8%, it spent four candles inside that area, failed to break through, and reversed back below the cloud.
If you use cloud breaks as entry signals, you must check thickness. A breakout through a thin cloud is not a setup.

The Chikou Span and the Price Range from 26 Candles Ago
The Chikou Span plots the current close 26 candles back on the chart. In English-language usage, it is often treated as a simple momentum comparison: current price versus price 26 candles ago. Hosoda's original method is stricter. It asks whether the Chikou Span has cleared the full price range of the candle from 26 candles ago, from high to low.
If the Chikou Span is trapped inside that prior candle's range, the market is still undecided in the same area it occupied one month earlier. If the Chikou breaks cleanly above that range, it confirms a long setup. If it breaks below, it confirms a short setup. This breakout is the third condition of Sanyaku Koten.
This confirmation is the final gate for an entry setup. Even if price breaks above the cloud and the Tenkan crosses the Kijun, the setup remains incomplete by Hosoda's standard if the Chikou Span is still trapped inside the price range from 26 candles ago. If the candle from 26 periods earlier was a large bullish candle, the Chikou may need several more days to clear it. That delay is a natural timing filter.
Sanyaku Koten: Three Conditions Aligned at Once
The Nikkei 225 daily chart is moving sideways inside the cloud after a major correction.Price closes above the cloud (condition 1),Tenkan is above Kijun at the same time (condition 2),Chikou cleanly clears the price range of the candle from 26 periods ago (condition 3),and the cloud on that candle is at least 2.5% thick on a closing-price basis.Enter long at the close of the candle where all three conditions are met at once.Place the stop below the cloud top.If Chikou falls back into the price range from 26 periods ago, or price returns inside the cloud, the thesis is wrong.
The key is that all three conditions must be on for that candle. A condition that turned on earlier is fine if it is still on. It does not have to switch on for the first time on the same candle. If any one of them is off on that candle, it is not a setup. A place where all three gather on one candle may only appear a few times a year, but those spots are far more reliable than any other way of using Ichimoku.
The same setup applies in reverse for short entries: price < cloud, Tenkan < Kijun, and Chikou < the price range from 26 candles ago.

Kumo Twist: Regime Change 26 Candles Ahead
The future cloud is already fully drawn. At the far right of the chart, in the 26-candle area that price has not yet reached, the cloud's color is already visible.
A Kumo Twist is the point where the future cloud changes color. A shift from green, Senkou A > Senkou B, to red indicates a bearish regime change. The reverse indicates a bullish regime change. A nearby twist gives advance information that the regime itself may change 26 candles later.
Treat the twist as a holding-period signal. If you use it as an entry trigger, it stops meaning anything as a setup. An entry setup with a twist within the next five candles of the future cloud is likely to have a short holding window, so reduce size or set a closer take-profit target. If the twist is near the far end of the future 26-candle cloud, the setup has more time left in its holding period.
Before USDJPY's daily-chart rally in October 2024, on October 10 (148.7 yen), the future cloud already showed a twist in mid-November. If you had noticed that twist, it would have been the place to set the October entry's profit target before mid-November. After the November 15 high (156.5 yen), pullback and sideways price action in a 149-156 yen range continued for about three weeks into early December, and that stretch would have been avoided.

Ichimoku Does Not Work Inside the Cloud
When price is inside the cloud, Ichimoku signal reliability drops sharply. Tenkan and Kijun cross frequently, and Chikou is often trapped inside the price range from 26 candles ago. The cloud is an area where the market has not chosen direction, and all Ichimoku signals inside it should be ignored.
Inside the cloud, other tools (price structure, ATR, and volume profile) are more accurate. Ichimoku earns its keep only in trending stretches outside the cloud.

Full Five-Line Alignment Comes Late in the Trend
A common trap for English-speaking Ichimoku traders is waiting for perfect alignment across all five lines: price > Tenkan > Kijun > cloud top, Chikou above the price from 26 candles ago, and a green future cloud. By the time all five are aligned, the trend is already well advanced.
This is exactly why Sanyaku Koten requires only three conditions. Hosoda understood that real entries occur before all five lines fully align. Entering when the three conditions are met usually puts you 5 to 15 candles ahead of traders waiting for full five-line alignment. Traders who wait for all five lines repeatedly enter late in the trend and are exposed to the pullback that often starts shortly after alignment.
On the USDJPY daily chart in the October 2024 rally, the three Sanyaku Koten conditions aligned on October 22 at 151.1 yen, while the five-line alignment appeared on November 7 at 154.3 yen. The price rise between these dates creates the difference in entry timing.

The Parameter-Change Trap
The starting point from the earlier section is to keep 9, 26, and 52, and to adopt other numbers only after comparing them under the same conditions. The commonly cited 7-22-44 (an attempt to adjust for a five-day week), 12-24-52 (an adjustment for a 24-hour market), and 5-13-26 (faster signals) are also only candidates until they pass that test.
Changing the periods also moves the Tenkan, the Kijun, the cloud, and the timing of signals. An explanation that the numbers fit the calendar cannot prove the performance of an alternative setting. The trap is changing the numbers without a test, or treating a calendar conversion as the more accurate value.
Two External Signals That Confirm the Setup
For a Sanyaku Koten setup to be robust, two signals outside Ichimoku should align with it.
- Volume: If the breakout candle through the cloud has volume at least 1.5 times the average of the previous 20 candles, treat it as a real breakout. A breakout on below-average volume often fails, even when Chikou confirmation appears with it.
- Weekly cloud direction: A daily Sanyaku Koten setup is strongest when it aligns with the direction of the weekly cloud. If the weekly chart is below the cloud and only the daily chart gives a long setup, it is countertrend. Reduce size and set a closer target.
The Ichimoku deep-dive series takes each piece further — Sanyaku, price-target theory, and time theory.