OptiNod Academy
Herding and social proof — Extreme positioning is not automatically a reversal signal
Betting against a crowded extreme may work near a reversal and fail repeatedly during a trend. Test conditional expectancy at extremes before treating sentiment as a contrarian signal.
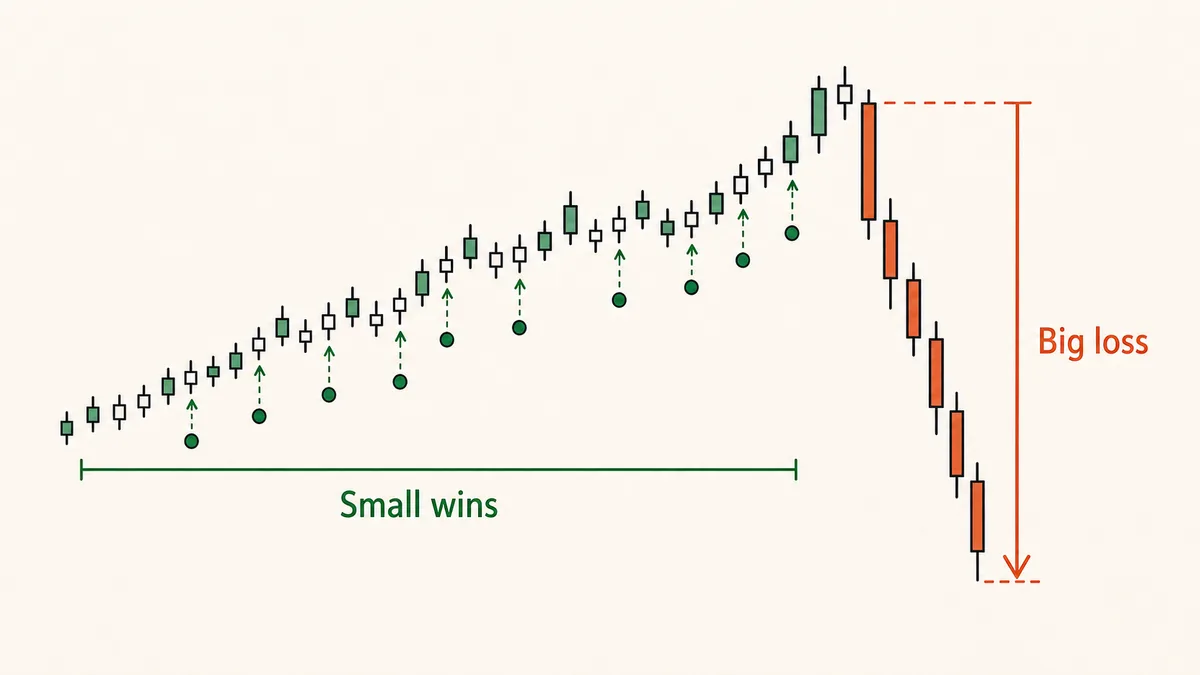
Betting against an extreme crowd can work near a turn and fail repeatedly in a trending market. Its value as a contrarian indicator is established only by measuring conditional expectancy in extreme periods.
Herding is the tendency to set aside personal judgment and follow the majority. Behavioral finance explains it as an information cascade, a concept introduced in 1992 by Bikhchandani, Hirshleifer and Welch. After observing earlier people's choices, an individual may ignore private information and follow the group. As the cascade grows, later participants can find it rational to disregard their own signals. Whether those signals are right or wrong, choices cluster around the visible majority.
A popular shortcut is “go against the crowd.” When the long/short ratio leans hard to one side, or the fear-and-greed index that maps market mood from 0 (extreme fear) to 100 (extreme greed) reaches an extreme, traders use that number itself as a contrarian signal. Memories of extremes that lined up with reversals keep the habit going. One crowding measure replaces the whole entry rule.
The cost has two sources. First, crowding can remain extreme for weeks during a trend, generating repeated losses for contrarian bets. Second, much of the long/short ratio, funding and fear-and-greed measures is calculated from recent price moves and volume, so the signal forms after price has moved. Even a 70% win rate on contrarian entries taken only at extremes can be unprofitable if the other 30% lose 3R each in trending markets. At an average win of 0.8R and loss of 3.0R, expectancy is 0.70 × 0.8R − 0.30 × 3.0R = −0.34R. The feeling that the win rate is high and the fact that the account is shrinking do not match. That difference shows up in the numbers when extreme periods are measured conditionally.

Social proof replaces the entry criterion
Herding appears in two forms. One is social conformity. In Solomon Asch's 1951 experiments, roughly 75% of participants followed an obviously wrong majority at least once, and on around one third of critical trials they set aside the answer visible to their own eyes. The other is an information cascade: seeing others buy leads a trader to infer that they have better information and set aside their own assessment.
In markets these combine at entry. When longs dominate the long/short ratio, a fear-and-greed index signals greed, and social feeds fill with buying calls, the trader may skip the process of checking the original signal and use the crowding itself as evidence. Joining the direction is conformity; betting against the extreme is contrarianism. In both cases, social proof has displaced the trade's actual entry rule.
Once the entry rests on one crowding measure, the trader may repeat it without separately testing when it works and fails. Crowding can describe the state of the market. Whether it predicts the next direction is a different question. Conflating the two gives a contextual indicator the job of an entry signal.
Contrarian sentiment fails repeatedly in trends
Extreme crowding can coincide with reversal when a trend is ending. In mid-January 2026, Bitcoin reached $97,924 on January 14 before falling about 39% to $60,000 by February 6. A short bet against extreme greed near that high could have returned far more than planned in a little over three weeks. This is a typical case where the contrarian indicator appears right.
The same signal can be repeatedly wrong in the middle of a trend. Bitcoin's rise from roughly $69,000 in early November 2024 to $108,353 on December 17, about 57%, lasted while long positioning and greed remained elevated. Shorts entered on the judgment “overbought, therefore a pullback” hit their stops repeatedly, every few days. The pattern recurred over four months in 2025: from the April 7 low of $74,508 to the August 14 high of $124,474, about 67%, extreme positioning did not force a reversal. It remained background evidence of a continuing trend.
The crucial difficulty is that the two environments cannot be distinguished from the extreme reading at entry. The same “extreme greed” number can occur just before a reversal and in week three of an advance. If crowding alone triggers trades, a few wins near turns can be surrendered through many trend-period losses. Mix all those trades into one sample and overall expectancy can be near zero or negative.

Crowding measures often derive from price itself
A second reason sentiment cannot automatically serve as an entry signal is how the measures are built. The funding rate comes from the price gap between futures and spot (the premium), and that premium grows as longs pile in while price rises. Long/short ratios count positions that accumulated after price moved. Fear-and-greed indexes often include volatility, market momentum and volume, all connected to recent price changes.
The extreme reading therefore appears after much of the price movement that produced it. When you see that “the crowd is extremely one-sided,” much of the underlying move is already history. Unless you test whether the measure contains independent information about future direction rather than summarizing past prices with a delay, you risk betting on stale information.
Lead-lag correlation can test the distinction. Calculate how a crowding measure correlates with returns over the following N bars at different lags. If correlation is high only at the same bar and near zero when the indicator leads future returns, it follows price without independent predictive information. That weakens the case for using it as an entry trigger. When crowded positioning feeds a liquidation cascade, price can even move opposite to the indicator's apparent direction.
Measure conditional expectancy only in extreme periods
Herding as a vague feeling is hard to diagnose. Isolate extreme periods and test them in three steps.
First, define extremes by a distribution, not a fixed number. Use the upper or lower percentile of the long/short ratio or funding over the previous N days. Mark only bars in, for example, the top or bottom 10%.
Second, model a contrarian entry on those bars and an exit M bars later, converting results into R. Expectancy in this extreme-only subset measures the apparent contrarian value.
Third, split that subset into trending and sideways markets and calculate expectancy separately. Separate a trend from a range by the size of a 200-bar moving average's slope, for example, or by a trend-strength reading such as ADX. The sign of the slope only separates an advance from a decline. It does not separate a range. In a range the expectancy is usually positive, in a trend it is usually negative, and combined they offset to around zero. Measured this way, the argument about whether the contrarian reading works becomes a conditional number. Add the lead-lag correlation from the previous section, and that decides whether the measure is an entry signal or only context.

Crowding is context, not an entry signal by itself
After measuring, keep one practical rule: use extreme positioning as background, while actual entry comes from price structure. Do not enter merely because an extreme appeared.
- Define extremes by percentile: Use percentiles over the previous N days for long/short ratios and funding, not one fixed absolute threshold.
- Require price confirmation: Once an extreme shows up, enter only after a price-structure signal such as a sweep, a break, or a confirmed pullback. Block entries that rest on crowding alone.
- Separate trends from ranges: Calculate expectancy on extreme-period trades separately for trending and sideways markets rather than relying on one blended number.
- Check whether it leads: Measure lagged correlation with later returns. If only same-bar correlation is substantial, remove the measure from entry rules.
- Tag the context: Record crowding at entry for every trade so later expectancy can be grouped by sentiment state.
The aim is not to become braver about fighting the crowd. It is to measure crowding conditionally and distinguish a measure useful for entries from one useful only for context.
Three pitfalls
“Negative funding always means a bottom.” Negative funding only means shorts pay the funding rate to longs. It does not say how overheated the shorts are, or whether a rebound is coming soon. Negative funding can last for days in a downtrend. Going long on negative funding alone, without the trend-versus-range split from the section above, piles up losses in the trending sample.
Fixing an absolute fear-and-greed threshold. The index's distribution changes over time. A number that was extreme in one year may be ordinary in a year with frequent greed, while a low reading can be extreme in a period dominated by fear. Fixed numbers miscount extremes; percentiles remain more comparable across periods.
Using a social feed as a sentiment index. A feed full of buying calls is itself a biased sample. People with long positions speak more, and winning positions get more exposure. Substituting that observation for a quantitative measure such as the long/short ratio distorts the measurement. Crowding should be measured with data.
A crowd's contrarian value is visible only in records
The main trap in herding is believing the rule because a few extremes lined up with reversals. That memory leaves out the many times the extreme was wrong again and again in a trend. The missing evidence shows up as a number only when you isolate the extreme stretches, measure conditional expectancy, and look at the lead-lag correlation between the indicator and future returns. Run that measurement, and the numbers decide whether the long/short ratio, funding, and the fear-and-greed index are an entry signal or only context.