OptiNod Academy
Candlestick Patterns — Morning and Evening Stars: Three-Candle Reversals (Part 4)
Morning Star and Evening Star patterns are better read in crypto as a failure-compression-confirmation sequence, not as textbook gap patterns.
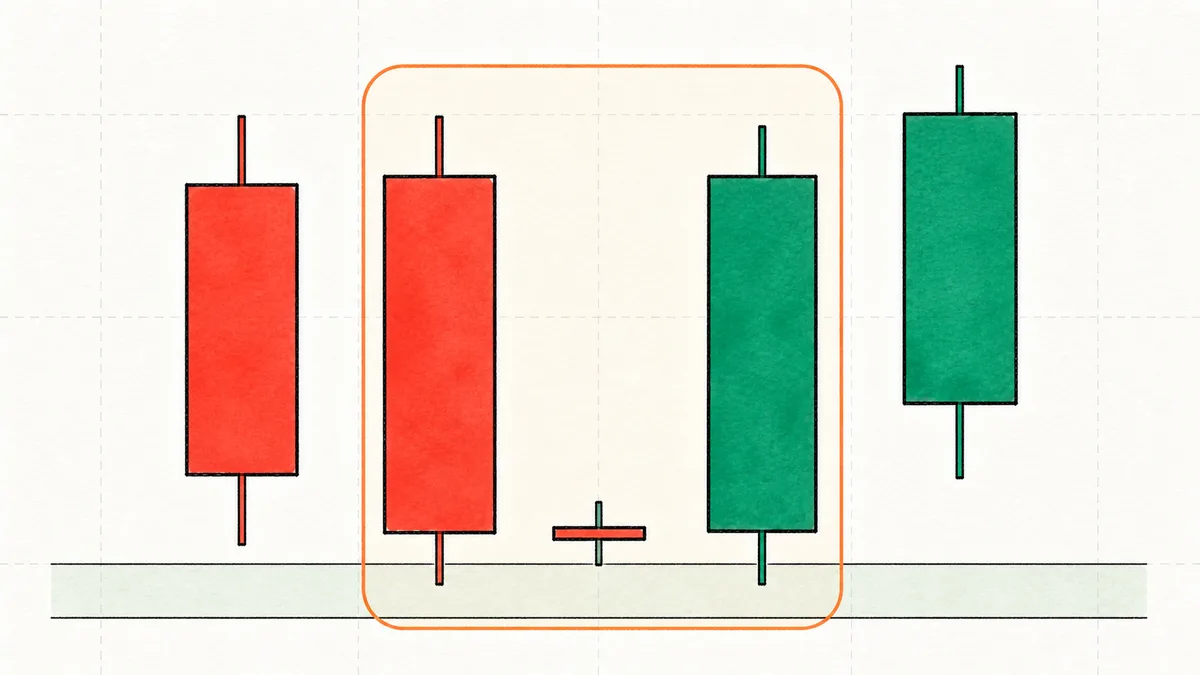
A Morning Star or Evening Star is a real reversal signal only when the first candle's exhaustion, the second candle's pause, and the third candle's retracement appear in that order.
In Morning Star and Evening Star patterns, the order of the three candles matters most. The first candle shows the existing move has become stretched. The second shows momentum slowing. The third resolves the setup by reclaiming or losing the key reference price.
In 24-hour crypto and futures markets, traditional gap conditions rarely appear. Instead of gaps, the pattern should be judged by the midpoint of the first candle, the low or high of the second candle, and where the third candle closes.
If the third candle does not retrace at least 50% of the first candle's body, it should not be treated as a reversal candidate. If price reclaims that 50% level and then defends the retest, the setup gives clear entry and stop criteria.
How star reversal patterns are built
A star reversal is a three-candle pattern.
Morning Star: A potential bottom reversal that appears near the end of a downtrend.
- First candle: large bearish candle
- Second candle: small body, bullish or bearish. In equities, it gaps down below the first candle. In 24-hour markets, it often closes small near the first candle's low without a gap
- Third candle: large bullish candle. It closes above the midpoint of the first candle's body
Evening Star: A potential top reversal that appears near the end of an uptrend. It is the inverse of the Morning Star.
- First candle: large bullish candle
- Second candle: small body. In equities, it gaps up above the first candle. In 24-hour markets, it often closes small near the first candle's high without a gap
- Third candle: large bearish candle. It closes below the midpoint of the first candle's body
The key test is whether the third candle closes beyond the midpoint of the first candle. The second candle's small body is the first sign of trend weakness, but the real confirmation comes from the third candle's retracement.
In 24-hour markets, gaps are rare
Morning Star and Evening Star patterns are traditionally described as three-candle reversal patterns that include gaps. The first candle is a strong candle in the direction of the existing trend, the second is a small hesitation candle, and the third is a confirmation candle in the opposite direction. In equity markets, gaps are part of the pattern.
But in crypto and 24-hour futures markets, gaps are rare. If you require the textbook gap condition, you will miss most valid three-candle reversals. If you ignore gaps entirely, you will mistake any three-candle bounce for a star pattern. In these markets, the pattern should be read through level failure and close confirmation instead.
This article focuses on three-candle reversal patterns. Check the sequence step by step: the first candle pushes the trend too far, the second fails to extend in that direction, and the third reclaims the reference price. Walking through these steps holds up in live trading, where memorizing the pattern as a fixed shape tends to break down.
A Morning Star confirms failed selling in three stages
The first candle in a Morning Star is a strong bearish candle. It reflects fear in the market. The second candle has a small body. It means price failed to continue lower at a point where fear should have carried through. Only when the third candle is bullish and price retraces more than half of the first bearish candle does the market confirm that seller pressure has failed.
The most important price is the midpoint of the first bearish candle. If the third candle cannot close back above that midpoint, the move is only a weak bounce and is hard to treat as a reversal. Once the midpoint is reclaimed, short sellers who chased the first bearish candle start to come under pressure.
The SOLUSDT daily candle on August 5, 2024 is not a formal three-candle Morning Star. On Binance spot it opened at $138.32, traded down to $110.00, and closed at $129.78, close to one candle with a long lower tail. Over the prior five trading days, SOL had fallen more than 20%. The three-candle Morning Star definition stays the same: a first bearish candle, a small second candle that does not extend the low much, and a third candle that closes back through the midpoint of the first candle. This article does not publish the opens and closes of those three candles as one set. The August 5 candle is only a variant in which that structure is compressed into one candle. Over the next three trading days, SOL rebounded about 25% on a closing-price basis.

The third candle's 50% retracement is the signal threshold
If the confirmation standard is too loose, almost every bounce becomes a Morning Star. The key threshold is a 50% retracement of the first strong candle. If price cannot close above the midpoint of the first bearish candle, sellers still have the advantage.
After a downtrend, the first candle is bearish and has a range at least 1.5 times the average range of the previous 20 candles.The second candle closes with a small body near the first candle's low and does not materially extend the low.The third candle closes back above at least 50% of the first candle's body.Enter when the next candle retests the midpoint of the first candle’s body and holds above it. Do not chase the third candle’s close without that retest.The stop goes below the second candle's low.If price closes back below the midpoint of the first candle within three candles after the third candle, the reversal has failed.
Applying this standard reduces the number of patterns but improves their quality. The purpose of a Morning Star is to identify the moment when the market reverses a large candle created by sellers. It aims at that turn, while picking the exact bottom stays a separate question.
An Evening Star shows a key level breaking after a sharp rally
The Evening Star is read in the opposite direction. The first candle is a strong bullish candle, and the second is a small candle that fails to continue higher. The third candle is bearish and closes below the midpoint of the first candle's body. That confirms weakening demand.
The LINKUSDT daily candle on December 16, 2024 is not a three-candle Evening Star either. It is one candle with a long upper tail, high $30.85 and close $28.73, the same candle read as a shooting star in Part 1. A formal Evening Star is a strong bullish candle, a small candle that fails to go higher, and a third bearish candle whose close drops below the midpoint of the first candle. Read this one candle only as that sequence compressed into a rejection. The roughly 20% drop over the next three daily closes is an example of the confirmation decline.

When an Evening Star appears, manage existing longs before immediately looking for shorts. Once price closes below the midpoint of the first candle, buyers who entered based on the rally candle have their average entry zone threatened. If price cannot reclaim that level, you need to take profit or raise your stop.
In gapless markets, watch the stall and the midpoint reclaim
In equities, a Morning Star includes gaps: a downside gap, a small star, and then an upside gap. A 24-hour market almost never has that gap, so split the gap’s job into two checks. One is the stall: for one to three candles after the first strong candle, price fails to extend further in the same direction. The other is whether the third candle’s close reclaims the midpoint of the first candle.
A small second candle is not enough on its own. If price continues to hold below the first candle's low, the market is still weak. Even if the second candle briefly breaks below the first candle's low, it needs to close back inside the range, and the third candle needs to reclaim the midpoint. That sequence is the star reversal structure in a market without gaps.

The main trap in star patterns is entering too late
Waiting for three-candle confirmation strengthens the signal, but it can also make the entry late. With star patterns, you need to choose one of two approaches. An aggressive trader enters small on a break of the second candle's high and adds after the third candle confirms. A conservative trader waits for confirmation from the third candle and then looks for a pullback.
The aggressive approach has a tighter stop but fails more often. The conservative approach has a higher hit rate but misses more moves. Both are valid. What matters is not mixing the two. If you enter on the second candle breakout, you must exit immediately if the second candle's low breaks. If you wait for third-candle confirmation, you need the patience to wait for a retest of the midpoint.
The worst approach is chasing at the end of the third candle's large bullish close while placing the stop below the second candle's low. The entry is late and the stop is far away, damaging the risk-reward profile. This is a common situation where the pattern read is correct but the trade structure is poor.

Candlestick patterns are one part of the trading plan
Candlestick patterns should be handled through location, close, and the next candle's behavior. A Hammer signals a failure to hold lower prices. An Engulfing pattern signals that the prior candle's body has been reversed. An Inside Bar marks compressed volatility. A star pattern is the sequence of exhaustion, pause, and retracement.
Each pattern gives the invalidation condition before it gives the entry. A Hammer fails when its low breaks. An Engulfing pattern fails when the reference candle breaks down. An Inside Bar fails when price returns inside the range. A star pattern fails when the reclaimed midpoint breaks again. Without invalidation, a candlestick pattern is only a description. With invalidation, it becomes a trading plan.