OptiNod Academy
Candlestick Patterns — Intrabar Flow and the Opening Drive (Part 10)
Two candles can look identical but mean very different things if they formed in different sequences. Intrabar flow is where the real pattern information sits.
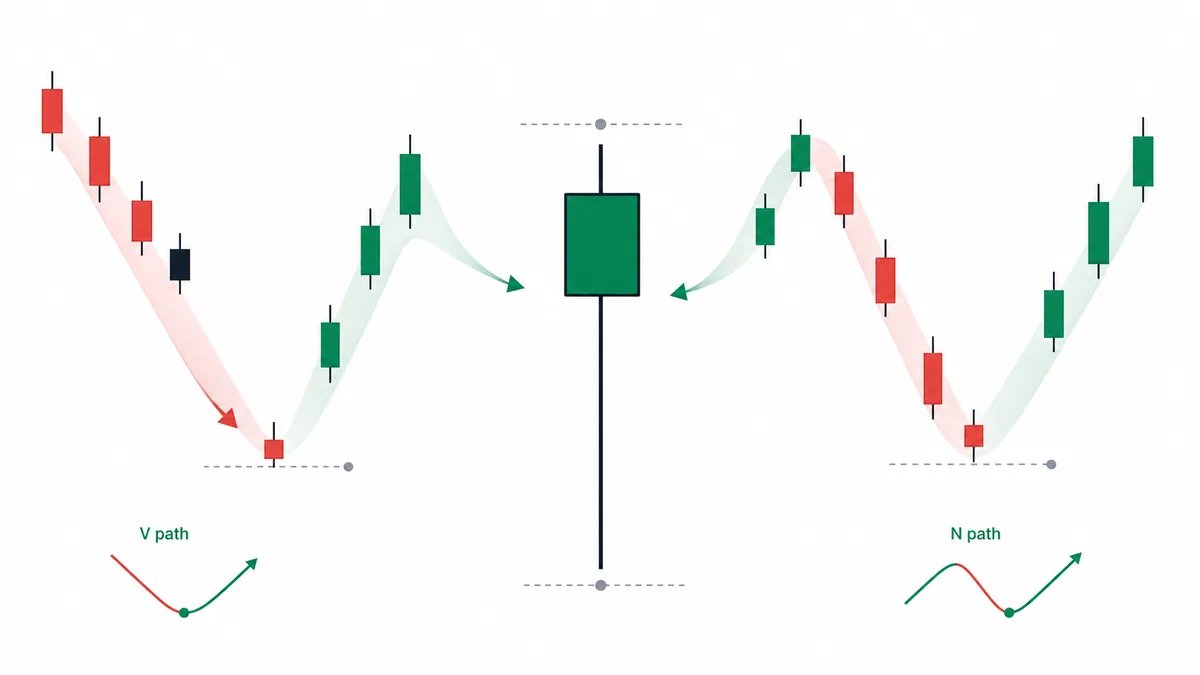
Even with the same hammer shape, a candle that opens, sells off to the low, then recovers into the close gives different information than one that opens, tags the high first, drops to the low, and only then recovers into the close. Shape is the starting point. Flow is the decision point.
Candlestick analysis usually starts from one assumption: once the candle closes, you only need to read its shape. The idea is that the body and wick proportions created by the open, high, low, and close reveal the balance between buyers and sellers. The framework Steve Nison introduced to Western traders in Japanese Candlestick Charting Techniques in 1991 rests on that assumption, and every pattern covered in this series so far follows the same convention.
But from the perspective of Auction Market Theory, a candle looks different. A candle appears to be a fixed shape, but it is really a compressed record of an auction that unfolded over time. Two candles with the same OHLC can reflect completely different participant behavior if price moved through those levels in a different sequence. Even hammers with the same outer shape mean different things depending on the order inside the bar. If price falls to the low right after the open and then recovers slowly, that is buying that came in after selling ended. If it tags the high first, falls to the low, and only barely recovers at the close, that is a recovery after the buy failed once.
This article covers Intrabar Analysis: reading the flow inside the candle. We will use two tools that correct every candle interpretation from the hammer definition in Part 1 through the multi-candle patterns discussed earlier in the series: the Opening Drive, and the sequence in which the high, low, and close were formed inside the candle. Together, they show how the same candle can carry the opposite meaning.

Two Hammers, Two Meanings: Intrabar Flow Makes the Difference
The standard hammer interpretation is clear. A small body, long lower wick, and short upper wick after a downtrend is treated as a reversal signal. But that interpretation assumes sellers acted first inside the candle and buyers came in later. That is the natural sequence implied by a candle that closes above its open with a long lower wick: after the open, price falls to the low, then rallies and closes above the open.
The problem is that another path can create the same OHLC. Consider a candle with an open at 100, high at 102, low at 95, and close at 101. In the first case, price moves from 100 open to 95 low, then to 102 high, then closes at 101. Sellers appear first and push price down 5 points. Buyers step in there and drive a 7-point recovery. The candle then gives back 1 point on late profit-taking. This is the classic V-shaped flow where selling pressure is absorbed and buyers take control.
In the second case, price moves from 100 open to 102 high, then to 95 low, then closes at 101. Buyers try first, lifting price 2 points right after the open, but fail. Price then drops 7 points and recovers 6 points near the end. The candle still looks like a hammer, but buyers were rejected first, and the close only barely reclaimed the open. The first candle shows buyer control after seller exhaustion. The second shows a failed buy attempt followed by a late save.
There was a real example on the SOL daily chart in 2025. On June 19 (close $147.04) and November 25 (close $138.96), hammer candles of nearly the same shape appeared. On the 5-minute chart, the sequences are opposite.
| Date | Right after the open | High | Low | Close | Shape inside the bar |
|---|---|---|---|---|---|
| June 19 | Rose first, to $147.41 | 00:40, $147.90 | 15:50, $142.92 | $147.04 | N-shape: rose, was pushed down, then recovered |
| November 25 | Fell first, to $137.64 | 23:15, $140.50 | 14:50, $133.13 | $138.96 | V-shape: pushed down first, then rose |
The day after June 19, price fell further to $135.69. The day after November 25, price rose to $144.75. The shapes were nearly the same, but the intrabar flow was opposite, and so was the result.
You cannot distinguish this by looking only at the daily candle. You need to break it down one timeframe lower and see which wick formed first. That is how you separate two very different cases hidden inside the same shape.
Opening Drive: The First 15 to 30 Minutes Define Most of the Candle
The Opening Drive is the direction price takes immediately after a candle begins: the first 15 to 30 minutes on a daily candle, or the first one or two lower-timeframe candles on an hourly candle. The concept was formalized in the Market Profile world by J. Peter Steidlmayer in the 1980s, but it applies directly to daily candlestick analysis.
The reason the Opening Drive matters is simple. It shows the first direction market participants committed to inside the candle. If price moves up right after the open, buyers acted first. If price moves down, sellers acted first. A candle where the first bet is rejected and a candle where the first bet is supported can close at the same price but lead to opposite next-candle behavior.
A textbook hammer should have a downward Opening Drive. Sellers come in right after the open, create the low, and buyers absorb that low and recover into the close. The close itself reflects the fact that sellers acted and failed. By contrast, a hammer with an upward Opening Drive means buyers acted first, failed, and the candle later rotated into selling. In that case, a close above the open is weak evidence of buyer control. It likely reflects short-term covering pressure near the close after the buy attempt failed.
BTC’s May 2, 2024 daily hammer fell to $56,912 over the first two hours and recovered to a $59,061 close: an early decline followed by recovery. Do not equate those full two hours with the first 15–30 minutes of Opening Drive. The similar November 24 hammer first rose to $97,999 within 30 minutes, showing a different early direction. Compare the same first 15–30-minute window for both; the two-hour description alone does not establish that Opening Drive direction determined the outcomes.
In 24-hour markets such as crypto, the “open” is based on the exchange’s daily session, often UTC 00:00 or KST 09:00. The Opening Drive still applies. You are looking for the first meaningful direction price takes after the candle begins.

The Real Information in the Wick Ratio: Which Wick Was Made First
The ratio between the upper wick and lower wick is one of the most important inputs in standard candlestick interpretation. A long upper wick is read as buyer rejection. A long lower wick is read as seller rejection. But that interpretation leaves out sequence.
Take a candle with both a long upper wick and a long lower wick, commonly called a long-legged doji. The standard reading is indecision or possible trend exhaustion because both sides were rejected. But the interpretation changes completely depending on whether the upper wick or lower wick formed first.
A doji where the upper wick forms first has this flow: open to high, meaning a failed buy attempt; high to low, meaning sellers entered; then low to close near the open, meaning selling was rejected into the close. This sequence is failed buying, seller entry, then late seller rejection. Since the final rejection is against sellers, the candle has a slight bullish bias. By contrast, a doji where the lower wick forms first moves from open to low, meaning a sell attempt; low to high, meaning a buyer counterattack; then high to close near the open, meaning buying was rejected into the close. Since the final rejection is against buyers, the candle has a slight bearish bias.
The same candle shape tilts in opposite directions depending on the sequence. Standard interpretation sees only two wicks and labels it indecision. Intrabar data often shows that the candle is already leaning slightly one way.
A good example appeared on the ETH 4-hour chart (UTC 16:00 candle) near $3,300 on November 26, 2024. The upper and lower wicks were almost the same length, but the 5-minute chart showed that the upper wick formed first. The sequence was 3,296 open to 3,338 upper-wick high, then to 3,252 lower-wick low, then 3,301 close. Buyers failed first, sellers entered, and selling was rejected into the close. That gave the candle a slight bullish bias, and ETH rose to $3,446 over the next 12 hours.
A candle that looked like indecision based only on wick length carried directional information once the wick sequence was added. That is why intrabar analysis is useful in live trading.

Breaking Down a Daily Candle with Tick Data
Tick data records each executed trade on an exchange in chronological order. It is the most precise way to break down a daily candle, but it is hard to access on most charting platforms and requires a lot of storage. A practical alternative is to decompose the daily candle into 5-minute candles. In a 24-hour market, one daily candle contains 288 five-minute candles. That resolution is enough to read the Opening Drive and the order in which the wicks formed.
The process is straightforward. Choose the daily candle you want to analyze. Open the 5-minute chart for the same asset and time range. The direction of the first 3 to 6 five-minute candles, or 15 to 30 minutes, gives you the Opening Drive. Then check which 5-minute candle created the daily high and which created the daily low. That gives you the wick sequence.
Consider a BNB daily candle from December 20, 2024. Near $678, a hammer formed with a long lower wick, which would be a bullish reversal signal under standard interpretation. But the 5-minute breakdown showed that price rose to $669 during the first 30 minutes after the open, giving it an upward Opening Drive. After a high of $680.58 at 02:35, price plunged to $618.69 between 08:00 and 12:00, then recovered to $678.60 over the following 12 hours. Failed buy attempt, sharp drop, long recovery into the close. The candle looked like a hammer, but the Opening Drive was upward, and the next daily candle fell further to $652.
Another example is the AVAX daily candle on July 16, 2025. The hammer near $22.66 is a V on the 5-minute chart. Over the first 30 minutes after the open it fell to $22.22, the low at 04:10 was $21.61, the high at 21:25 was $23.02, and it slowly recovered to a close of $22.66. The early-session direction was down. The next daily candle rose to $24.34. The outer shapes of the two cases were similar, but the Opening Drive direction and the order the wicks were made split the outcomes.
If you do not have 5-minute data, 15-minute candles can still be useful. The resolution is weaker, but you can often identify the Opening Drive. Breaking a daily candle into 1-hour candles is not useful. With only 24 candles per day, the first one or two candles contain too much noise.

Intrabar Setups: Enter When Shape and Flow Align
You can improve the hit rate by taking only candles where both shape and flow point in the same direction.
When an apparent hammer forms on the BTC daily chart, immediately open the 5-minute chart. Check whether the first six 5-minute candles, or 30 minutes, moved downward. This confirms a downward Opening Drive.Confirm that the daily low formed in the first third of the 5-minute sequence, meaning within the first 96 candles of a 24-hour session.If both conditions are met, enter long at the hammer close.Place the stop below the hammer low. Use a break of that structural low as the invalidation criterion rather than a fixed dollar offset.Invalidation: if the next daily candle’s 5-minute chart breaks the hammer low during the Opening Drive phase, meaning the first 30 minutes, exit immediately.
When a doji with similar upper and lower wick length forms on the ETH 4-hour chart, break it down on the 5-minute chart and identify whether the upper wick or lower wick formed first.If the upper wick formed first, giving the doji a slight bullish bias, and the previous 4-hour candle was bearish, enter long at the doji close.Place the stop below the doji’s lower-wick low.Invalidation: if the next 4-hour candle closes below the doji low, exit immediately.
Both setups turn candles that would look ambiguous or ordinary on shape alone into clearer directional setups using intrabar data.
Traps: Where Intrabar Analysis Gets Misused
- Treating low-volume Opening Drive as real direction: Do not define low-liquidity hours solely by a fixed UTC window. Check actual volume and order-book depth for the exchange and symbol, and distinguish thin-book noise in the first 30 minutes. UTC 02:00–06:00 is KST 11:00–15:00; KST 09:00 is UTC 00:00. Keep candle boundaries and session times separate, and consider the first 2–3 hours together if volume is insufficient.
- Forcing the method on assets with poor 5-minute data: Low-market-cap assets or newly listed assets often have empty stretches on the 5-minute chart. If an asset only has one or two trades per 5-minute candle, its intrabar structure is not reliable. Use this analysis only on actively traded assets where enough executions accumulate in each 5-minute candle to make direction meaningful.
- Entering anyway when the flow does not match the surface pattern: If a candle looks like a hammer but has an upward Opening Drive, treat it as a non-reversal candle. The point is to set aside the standard interpretation and wait for a candle where shape and flow agree. Some assets may not produce a valid candle for an entire week. Avoiding forced trades is one of the secondary benefits of intrabar analysis.
Confirmation: Two Ways to Improve Intrabar Signal Quality
The first confirmation is overlap with the volume profile. If the entry area identified through intrabar flow lines up with a cumulative volume node on the daily chart, such as a POC or HVN, confidence improves noticeably. If a hammer low overlaps with the HVN from the prior month’s volume distribution, buying at that level carries more weight than a simple bounce from the low.
The second confirmation is an Order Flow Imbalance signal. Some exchanges or data providers separate buy volume and sell volume for each 5-minute candle. If buy executions clearly dominate sell executions on the 5-minute candle that creates the hammer low, that area marks where meaningful buy-side size actually came in. Adding this data makes intrabar analysis more robust.
Closing the Series: Shape Is the Starting Point, Flow Is the Decision Point
The conclusion of this 10-part series is simple. Every candlestick interpretation, from the hammer in Part 1 to the multi-candle patterns in Part 9, starts with shape. Shape only gives a rough picture of what market participants tried to do. The actual trading decision should come after you verify the sequence of trading inside the candle. The same hammer is a different candle when it forms through a V-shaped flow versus an N-shaped flow. The same doji is a different signal when the upper wick forms first versus the lower wick. Shape is the starting point. Flow is the decision point. That is the single idea running through the entire series.
